
Figure 3.
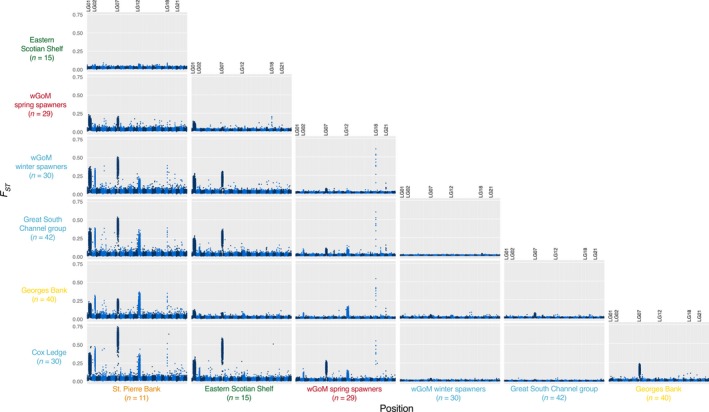
Manhattan plots displaying pairwise FST estimated in 15 kb windows among sampling locations and groups. Within each pairwise comparison, LG 1 to LG 23 are displayed from left to right with alternating dark blue and light blue colors. The positions of LGs with significant peaks discussed in the text are labeled. The colors of the labels represent our a priori understanding and expectations of population structure, as in Figure 1. The number of individuals in each group is given in parentheses