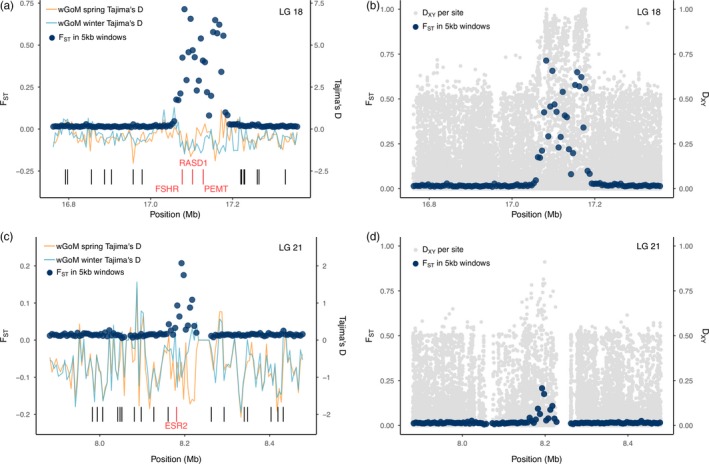
Figure 4.

(a) Pairwise FST estimated in 5 kb windows for the outlier peak on LG 18 between wGoM spring spawners and wGoM winter spawners (dark blue points). Tajima's D, estimated in 5 kb windows, is displayed for each group by the orange (spring spawners) and light blue lines (winter spawners). The locations of gene annotations are shown by the black bars, with the red bars highlighting the genes under the peak. (b) Pairwise FST, estimated in 5 kb windows, is overlaid over per‐SNP estimates of dxy between spring and winter spawners for the same region of LG 18 as in part a. (c) Pairwise FST and Tajima's D, estimated in 5 kb windows, for the outlier peak on LG 21, also for the wGoM spring spawners and wGoM winter spawners. Colors are the same as in a. (d) Pairwise FST, estimated in 5 kb windows, is overlaid over per‐SNP estimates of dxy for the same region of LG 21 as in part c
