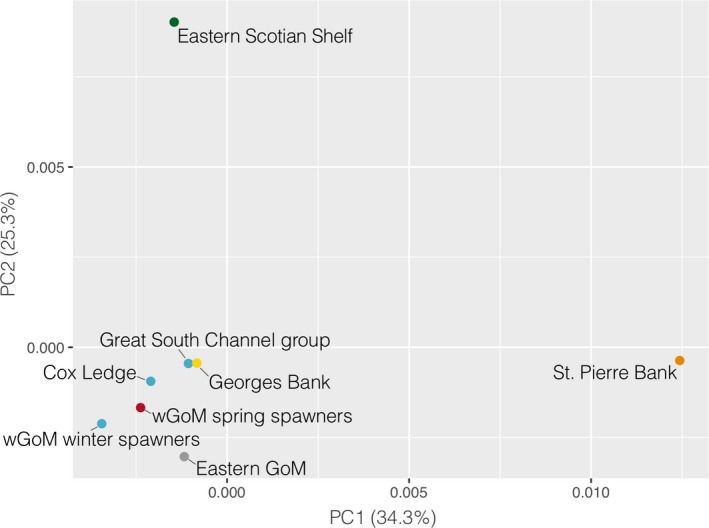
Figure 6.

MDS plot showing the population structure based on the neutral SNP data set for PC1 and PC2. The colors represent our a priori understanding and expectations of the population structure: red and blue = northern spring coastal complex and southern complex, respectively, of Kovach et al. (2010); yellow = Georges Bank; green = eastern Scotian Shelf; orange = St. Pierre Bank; gray = eastern GoM
