Figure 4.

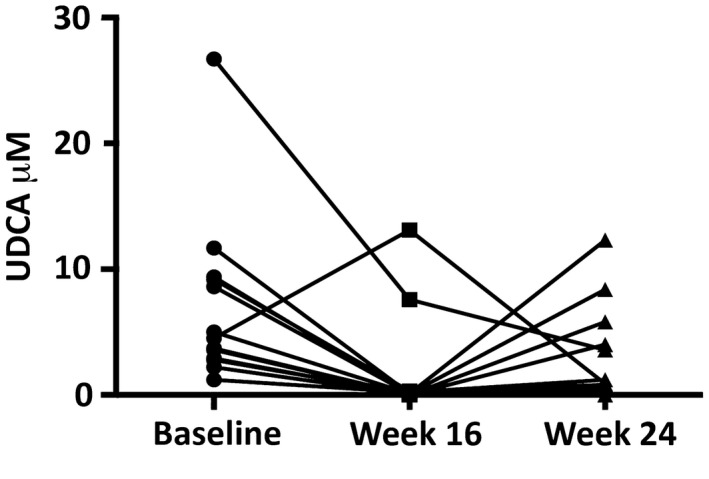
Plasma UDCA levels in 13 study participants at baseline (circle) and at 16 (square) and 24 (triangle) weeks. Each line represents an individual participant.

Plasma UDCA levels in 13 study participants at baseline (circle) and at 16 (square) and 24 (triangle) weeks. Each line represents an individual participant.