
Figure 1.
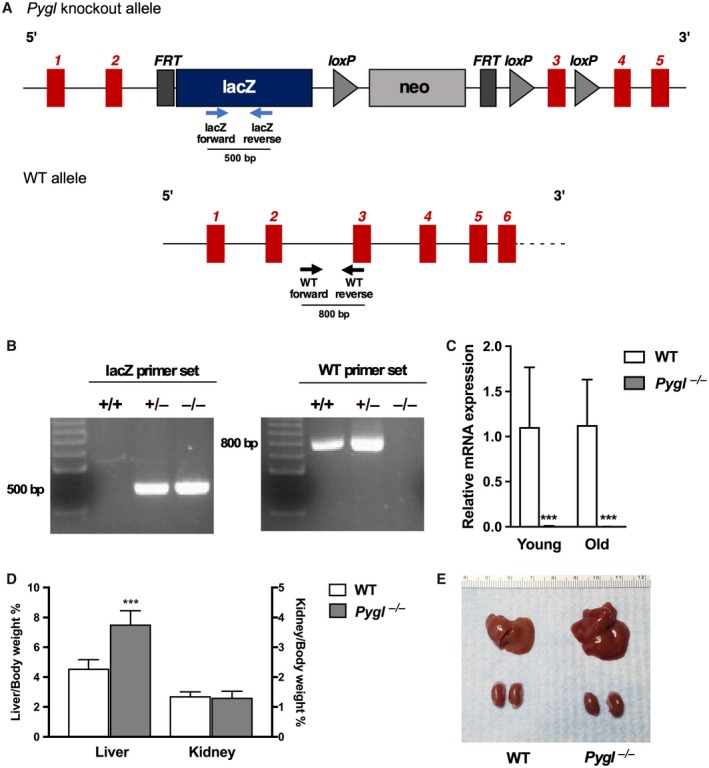
Generation of Pygl‐deficient mice. (A) Schematic representation of the Pygl‐knockout and WT alleles. Insertion of the FRT/loxP cassette in the intron between exon 2‐3 disrupts Pygl mRNA expression. Arrows indicate WT or lacZ primers used for genotyping. (B) PCR genotype analysis of WT (+/+), heterozygous (+/–), and Pygl −/− mice. The lacZ primer set and the WT primer set are expected to amplify a fragment of 500 bp and 800 bp, respectively. (C) Quantification of hepatic mRNA for Pygl in young WT (n = 9) and Pygl −/− (n = 24) mice and old WT (n = 16) and Pygl −/− (n = 13) mice. (D) Liver and kidney weights expressed as percentage of body weight. Numbers of mice analyzed were young WT (n = 13) and Pygl −/− (n = 24) mice for liver weight and young WT (n = 7) and Pygl −/− (n = 17) mice for kidney weight. (E) Representative image of liver and kidney in WT and Pygl −/− mouse. Scale shows length in centimeters. Data in (C,D) represent mean ± SD. ***P < 0.0001.