
Figure 2.
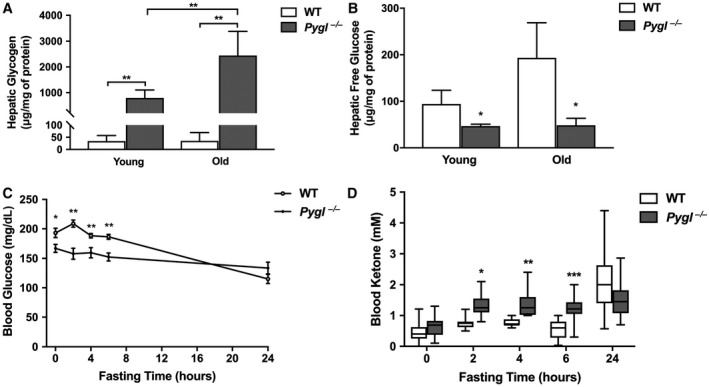
Pygl −/− mice exhibit excessive hepatic glycogen accumulation along with fasting ketotic hypoglycemia. (A,B) Hepatic glycogen and free glucose levels in 24‐hour fasted young and old WT (n = 5) and Pygl −/− (n = 6) mice. (C) Fasting glucose test in young WT (n = 12) and Pygl −/− (n = 17) mice. (D) Box‐and‐whisker plots of fasting blood ketone levels in young WT (n = 18) and Pygl −/− (n = 18) mice. Statistical analyses of box‐and‐whisker plots were performed using the Mann‐Whitney test and show the interquartile range (box), median (horizontal line), and maximum and minimum observations (whiskers). Hepatic glycogen and free glucose data (A,B) present the mean ± SD. Fasting glucose data (C) are expressed as the mean ± SEM. *P < 0.05, **P < 0.01, ***P < 0.001.