Figure 4.

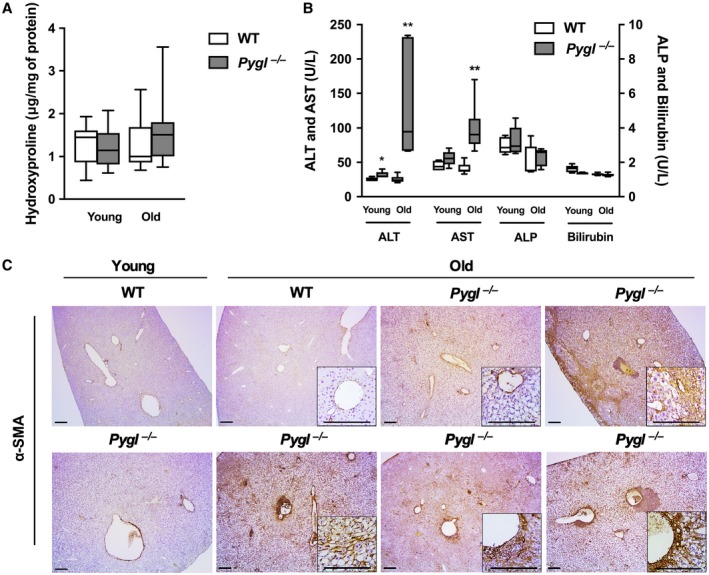
Elevated serum transaminases and activated HSCs in old Pygl −/− mice. (A) Box‐and‐whisker plots for quantification of hepatic hydroxyproline in both young and old WT (n = 11) and Pygl −/− (n = 13) mice. (B) Box‐and‐whisker plots showing serum levels of ALT, AST, ALP, and bilirubin in young WT (n = 5) and Pygl −/− (n = 5) mice and old WT (n = 6) and Pygl −/− (n = 6) mice. Data in (A,B) show the interquartile range (box), median (horizontal line), and maximum and minimum observations (whiskers). Statistical analyses were performed using the Mann‐Whitney test. *P < 0.05, **P < 0.01. (C) Immunohistochemical analysis of α‐SMA. Old Pygl −/− mice exhibited elevated but variable numbers of α‐SMA‐positive cells in periportal, perisinusoidal, and/or lobular areas in their liver sections. The insets show higher magnification views. Scale bars represent 200 µm.
