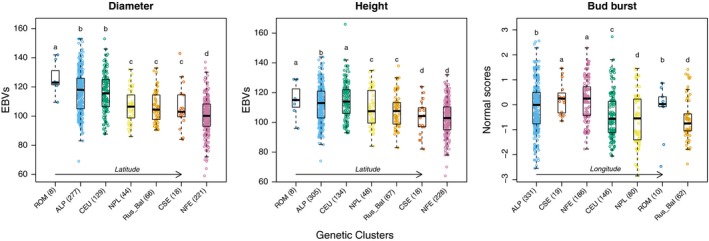
Figure 2.

Influence of trees origin on phenotype. Diameter, height (breeding values, BVs) and bud‐burst (normal scores) values are represented for the different genetic clusters (Carpathian, dark blue, ROM; Alpine, light blue, ALP; Central Europe, green, CEU; Northern Poland, yellow, NPL; Russia‐Baltic, orange, Rus‐Bal; central and southern Sweden, red, CSE; Fennoscandian, pink, NFE). The genetic clusters are ordered regarding latitude for height and diameter and given longitude for bud‐burst. The number of trees belonging to each genetic cluster is given within parentheses. Letters represent the levels of significance
