Figure 3.

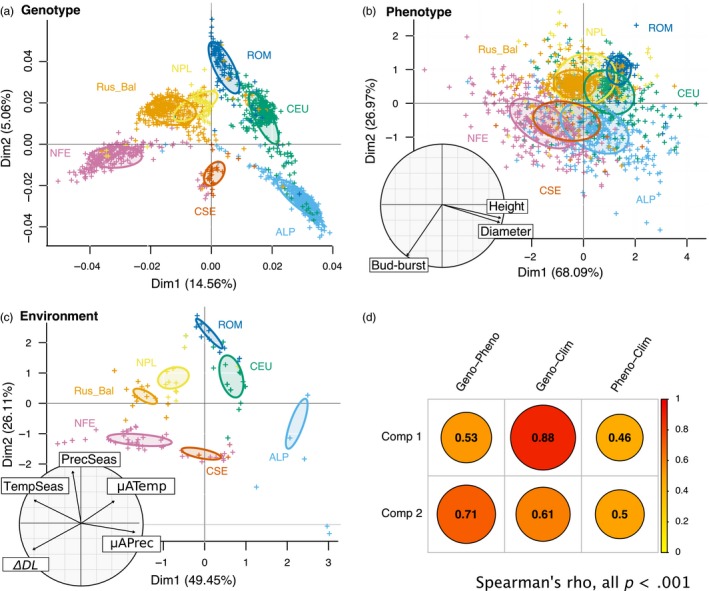
Pattern of variation of trees genotype, phenotype and original environment. Principal component analyses (PCA) based on (a), SNPs data (modified from Chen et al., 2019), (b) Phenotypic data and (c), climatic variables of the populations of origin (see Table S3 for climatic variable details). Correlation circles for phenotypic (b) or climatic variables (c) used for the respective PCA analysis are also represented. Colours correspond to genetic clusters (Carpathian, dark blue, ROM; Alpine, light blue, ALP; Central Europe, green, CEU; Northern Poland, yellow, NPL; Russia‐Baltic, orange, Rus‐Bal; central and southern Sweden, red, CSE; Fennoscandian, pink, NFE). Panel (d) represents Spearman's correlation coefficient, r, between principal component 1 (Comp 1) or 2 (Comp 2) of the various PCA, disc diameters are proportional to the corresponding correlation coefficient
