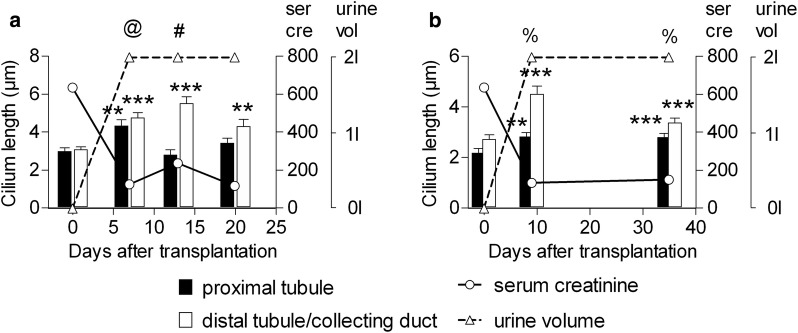
Fig. 2.
Renal primary cilium elongation during allograft rejection. Quantification of cilium length in an allograft suffering acute cellular rejection (a) and an allograft suffering antibody-mediated rejection (b). Bars show mean ± SEM for 50 cilia. **p < 0.01 and ***p < 0.001 relative to day zero for this segment as assessed by one way ANOVA with Dunnett’s test. The type and severity of rejection that each allograft underwent is indicated using the Banff Scale. @Banff IA rejection, #Banff IIA rejection, %antibody mediated rejection Grade II. Serum Creatinine (solid line) is shown as µmol/L and urine output (dashed line) to a maximum of 2 L

