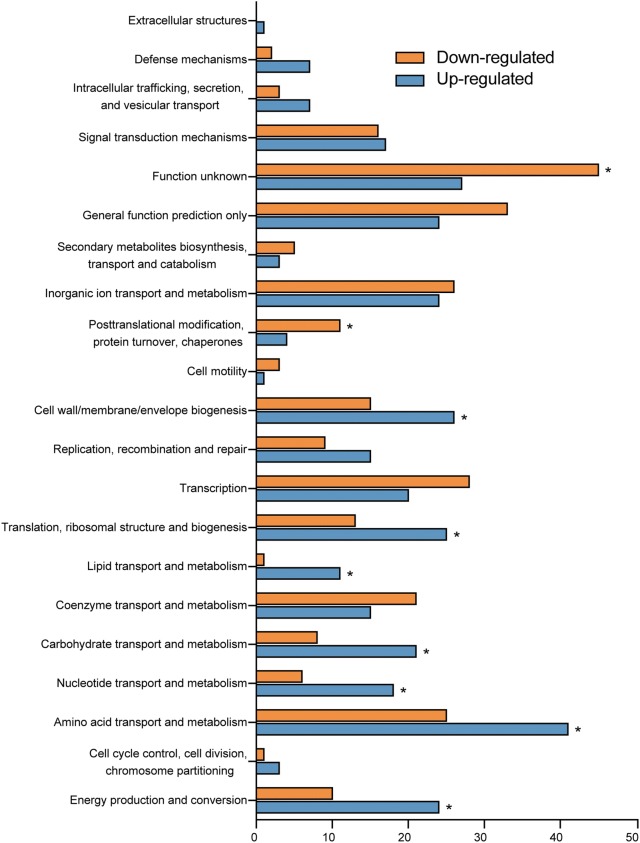
Fig. 2.
Clusters of orthologous group (COG) analysis of RstA-regulated genes in EHEC O157. Bars represent the number of up-regulated (blue) or down-regulated (orange) genes in the ΔrstA mutant compared to those in the EHEC O157 WT strain. The significant enrichment of a given COG in the sets of up- or downregulated genes was determined using one-tailed Fisher’s exact test with Benjamini–Hochberg false discovery rate correction

