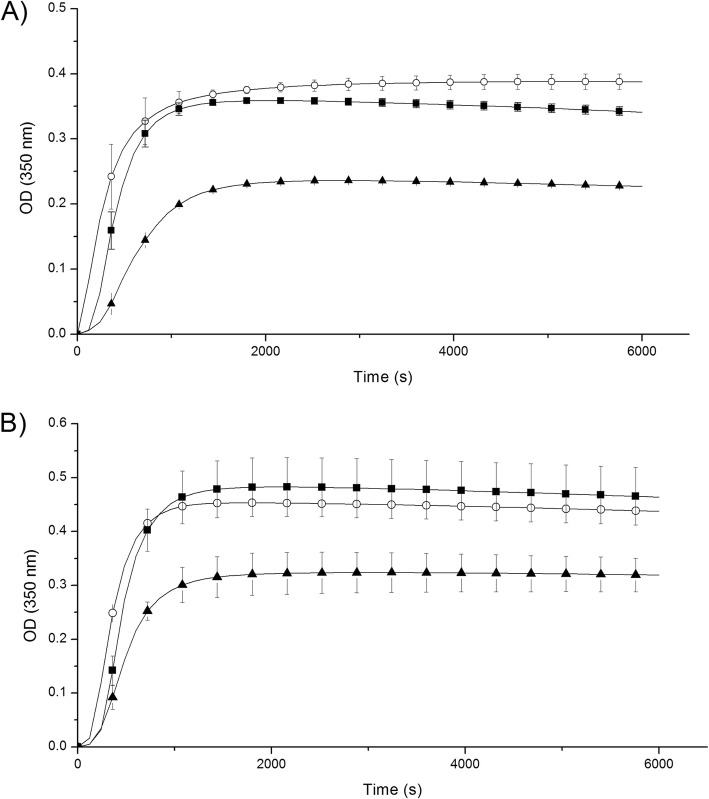
Fig. 1.
Kinetics of fibrin formation at different fibrinogen γ/γ’ concentrations. Clots were formed by mixing purified or commercial fibrinogen γ/γ and γ/γ’ with 1 nM thrombin and 2 mM CaCl2, final concentrations. The OD changes were recorded at 350 nm each 2 min, during 1 h 40 min. A Clot formed on the top HMEC-1. B Clot formed without HMEC-1. Fibrinogen γ/γ’ 3% (◯); fibrinogen γ/γ’ 10% (■); fibrinogen γ/γ’ 30% (▲)

