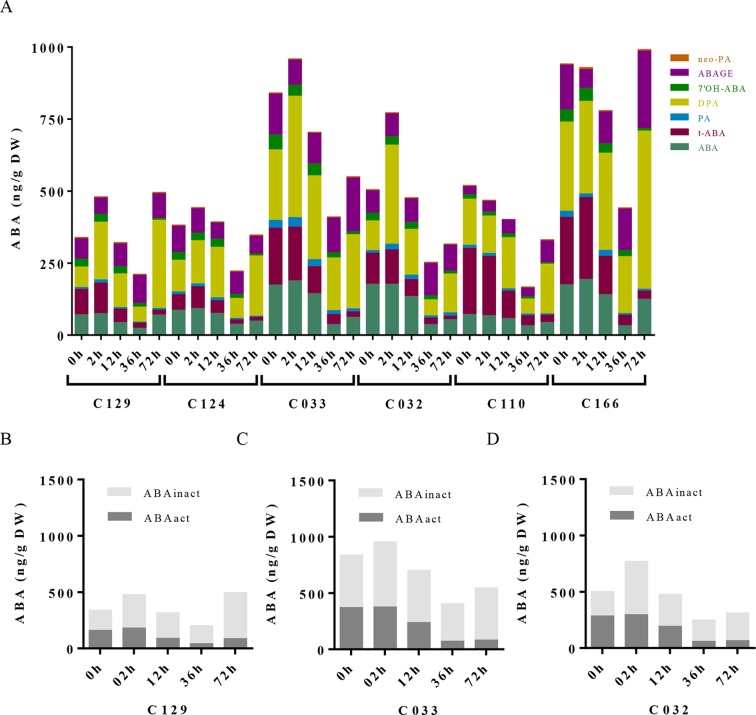
Figure 3.
ABA metabolite profile in WOSR accessions has uncovered the contribution of ABA pathway to variability on B. napus seed germination dynamics. (A) ABA levels progressively diminished along germination in all WOSR accessions, but steady state levels of ABA in dry seeds varied between them. Stacked columns histograms show the distribution of ABA and related metabolites (ABA, PA, DPA, 7′-OH-ABA, neoPA, and ABA-GE) in the WOSR accessions during seed germination. (B), (C), and (D) Levels of ABA active (ABA + t-ABA) and inactive ABA metabolites (DPA, ABAGE, PA, 7’OH-ABA, and neo-PA) are higher in C032 and C033 compared to C129, correlating with lower germination rates. Stacked columns histograms show the relative accumulation patterns of ABA active and inactive metabolites in C129, C033, and C032 accessions, respectively. All data were obtained using three pooled biological replicates (50 seeds per replicate). For complete value data set, see Supplementary Table S1 (Datasheet 3).

