Figure 6.
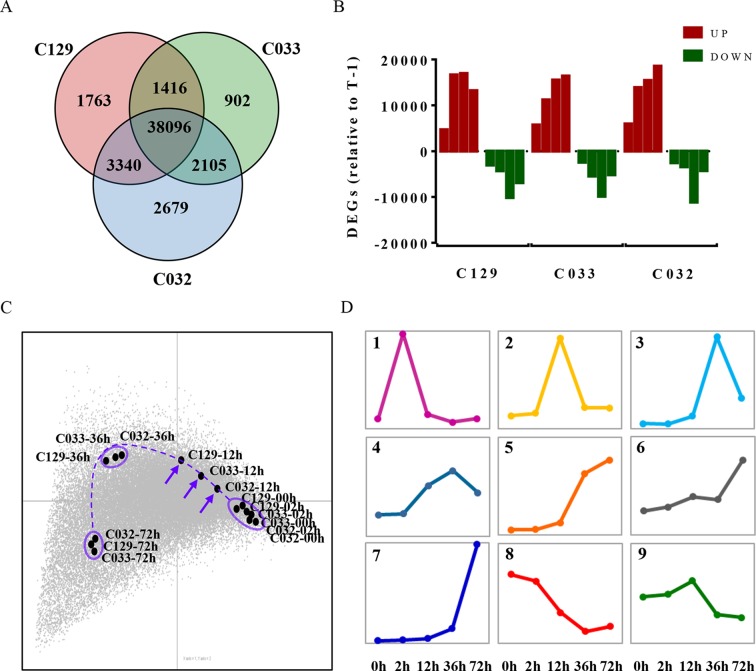
Differential gene expression and transcriptomic dynamics define seed germination in B. napus winter accessions. (A) Comparison of differentially expressed genes (DEGs) in winter oilseed rape (WOSR) accessions with different germination kinetics showed a common transcriptional regulation. Venn diagram of differentially expressed genes during germination of C129, C032, and C033 seeds from 0 to 72 hai. We compared each time point with 0 hai and also to its previous time point and selected those genes that showed a -1 > log2 FC > 1 in at least one of the comparisons. Our final list for C129, C033, and C032 contained 44,615, 42,519, and 46,220 DEGs, respectively. (B) Comparison of successive time points for significantly upregulated (red) and downregulated (green) transcripts revealed differences in the timing of significant alterations in the transcriptome. Quantification of the number of DEGs between successive time points during germination in WOSR accessions.T-1 stands for previous time point (C) The dynamics of the transcriptional changes associated with the progress of seed germination uncover crucial differences at 12 hai between WOSR accessions. Correspondence analysis between DEGs and WOSR accessions (C129, C033, and C032) during seed germination. DEGs (-1 > log2 FC > 1) are represented as a gray dot cloud modeled by the samples (labeled black dots). For each time point, samples tend to lie close to their higher differentially expressed genes, and similar samples tend to stay closer, meaning that they show very similar gene expression profiles. The farther the points are from the origin, the stronger the association between genes and samples. A dashed purple line traces an imaginary trajectory that would represent the dynamics of the transcriptional changes associated with the progress of seed germination. The purple arrows point to the germination time where transcriptional differences between samples are bigger. (D) Identification of major clusters representing gene expression dynamics defines a wave of transcriptional activation preceded by an early transcriptional repression during germination of B. napus. K-means clustering of differentially expressed genes during C129 seed germination. We use Fuzzy K-means algorithm with Cosine dissimilarity index (1 - Cosine similarity), number of iterations 10, coefficient of fuzziness 1, and initialization random method. The graphs correspond to each of the nine primary clusters obtained (panels 1–9). Each cluster corresponds to a particular gene expression dynamic represented by the colored line. The x-axis represents time after imbibition (2, 12, 36, and 72 hai). Pooled samples of 30 seeds each were used with three biological replicates for each time point.

