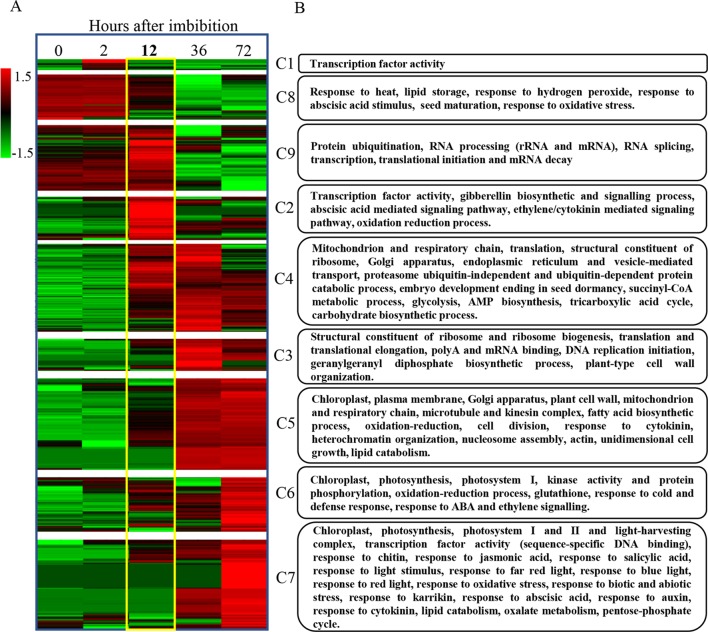
Figure 7.
Progressive gene expression and functional gene categorization outline a transcriptomic and genetic framework for seed germination in B. napus. (A) The identification of the major patterns of gene expression during seed germination highlights 12 hai as a key point for a major switch in transcriptome dynamics. Hierarchical clustering of previously k-means categorized DEGs from C129 WOSR accession and chronological representation of the corresponding heatmaps. Expression values in TPMs for genes included in each gene expression profile, obtained by k-means clustering, were normalized by genes and log transformed, separately. Then, hierarchical clustering using Pearson correlation (complete linkage) and gene leaf order optimization was applied for each cluster (clusters 1–9). The gradient green to red scale represents relative expression units for gene repression or gene induction, respectively. (B) We identified the most relevant biological processes being altered during germination in B. napus. Functional enrichment for the B. napus genes included in each of the previous clusters. The heatmap represents the number of significant functional categories (GO categories) for each cluster obtained by the SEACOMPARE from AgriGO v1.2 (Du et al., 2010) using the B. napus GOs and the corresponding p-value obtained with SeqEnrich prediction tool (Becker et al., 2017). The heatmap on the left is a schematic representation of the number of GOs with a p-value < 0.001 cut. P-values > 0.001 are represented as value 1 for graphic simplification. On the right, a summary of some of the most representative functions encompassed in each cluster is presented (see Supplementary Table S2, Datasheet 14, for detailed GOs).

