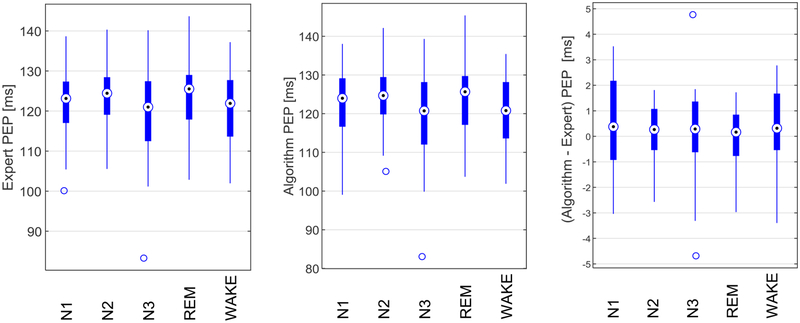
Figure 3.
Box plot of the expert and algorithm estimated PEPs and their differences. The central circles indicate the median, and the bottom and top edges of the boxes indicate the 25th and 75th percentiles, respectively. The whiskers extend the most extreme data points not considered outliers, and the outliers are plotted individually by the ‘ס’ symbol.

