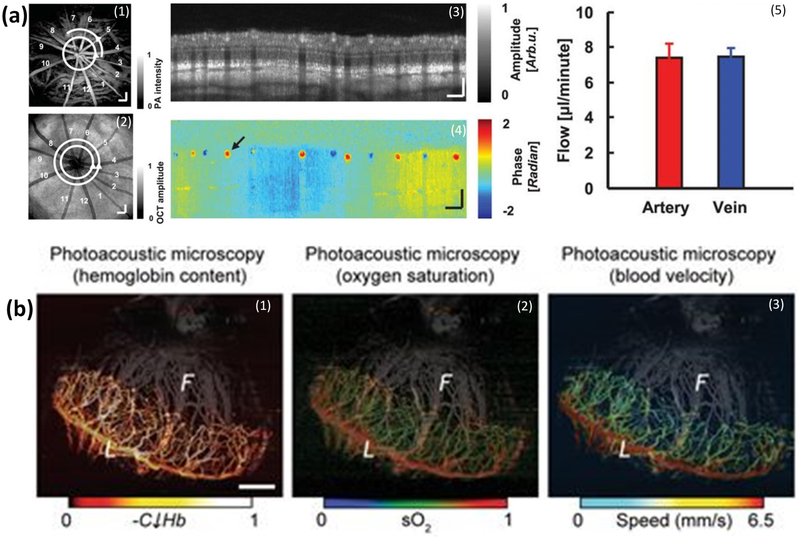
Figure 11.
(a) Integrated PAOM and OCT for the quantification of a retinal oxygen metabolic rate. (a1) shows an en face PAM image of the retinal and choroidal vessels obtained at the wavelength of 570 nm. (a2) En face OCT image, (a3) B-scan OCT image acquired along the white circle in (a1), (a4) phase shift OCT image, and (a5) measured flow rate in the retinal and venous systems [9]. (b) Functional imaging of relative hemoglobin content (“CHb”), SO2 saturation, and blood velocity in the angiogenic corneal network obtained using PAOM. The iris vasculature, which is pseudo-colored in gray based on vessel depth, is visible in the background of each image [85]. Adapted with permission from [9,85].

