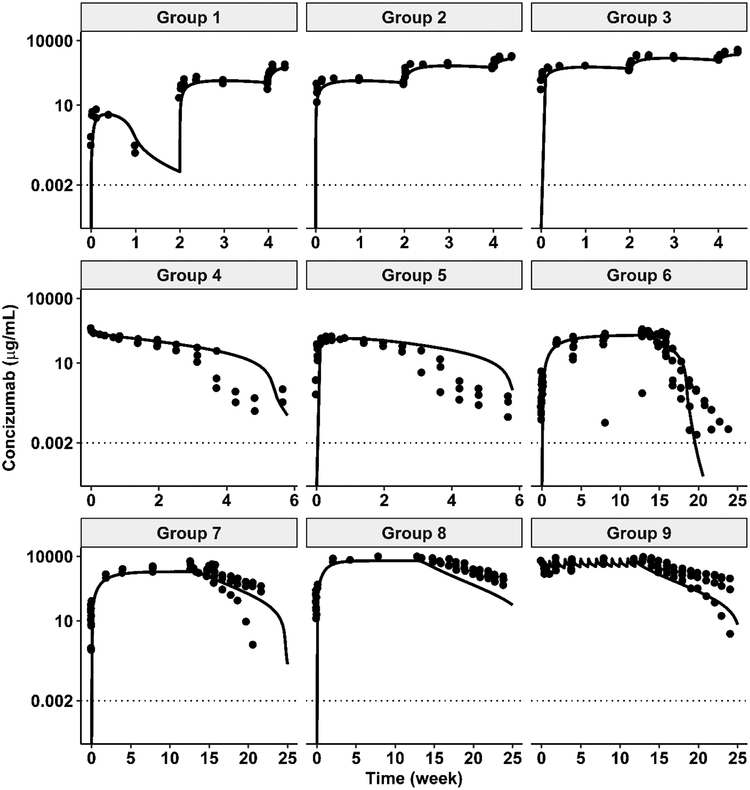
Figure 5.
The systems PK/PD model simulations of concizumab in monkeys. The symbols are observations and lines are model predictions. Dotted horizontal lines are the reported LLOQ for concizumab (Agerso et al., 2014). Group 1, 2, and 3: SC single dose escalation study at two-week intervals, 2-20-80 mg/kg, 20-80-160 mg/kg, and 80-160-200 mg/kg, respectively; Group 4 and 5: IV and SC single dose at 20 mg/kg; Group 6, 7 and 8: SC 91 daily doses at 1 mg/kg, 10 mg/kg, and 50 mg/kg, respectively; Group 9: IV 13 daily doses at 200 mg/kg.

