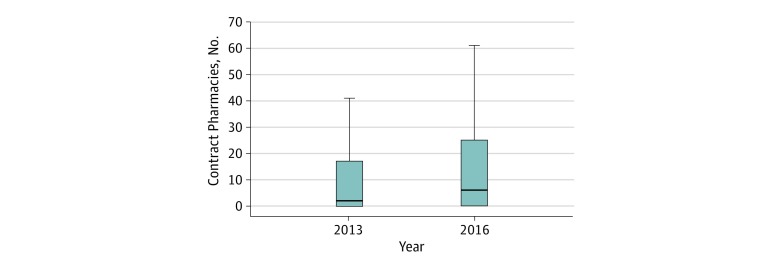
Figure 3. Distribution of Contract Pharmacy Relationships Among 340B Participating Hospitals, 2013-2016.
Calculations based on data constructed and described in eTable 1 in the Supplement. The sample includes nonprofit and public general acute care hospitals participating in the 340B program in each year. Contract pharmacies were identified and counted using the 340B covered entity list, which reports the existence and name of each active contract pharmacy relationship that the 340B participating hospital has in each year. Box plots display the number of contract pharmacy relationships among 340B hospitals in 2013 and 2016. The top and bottom borders of each box represent the 75th and 25th percentile, respectively, and the center line inside each box represents the median. The whiskers represent 1.5 times the interquartile range.

