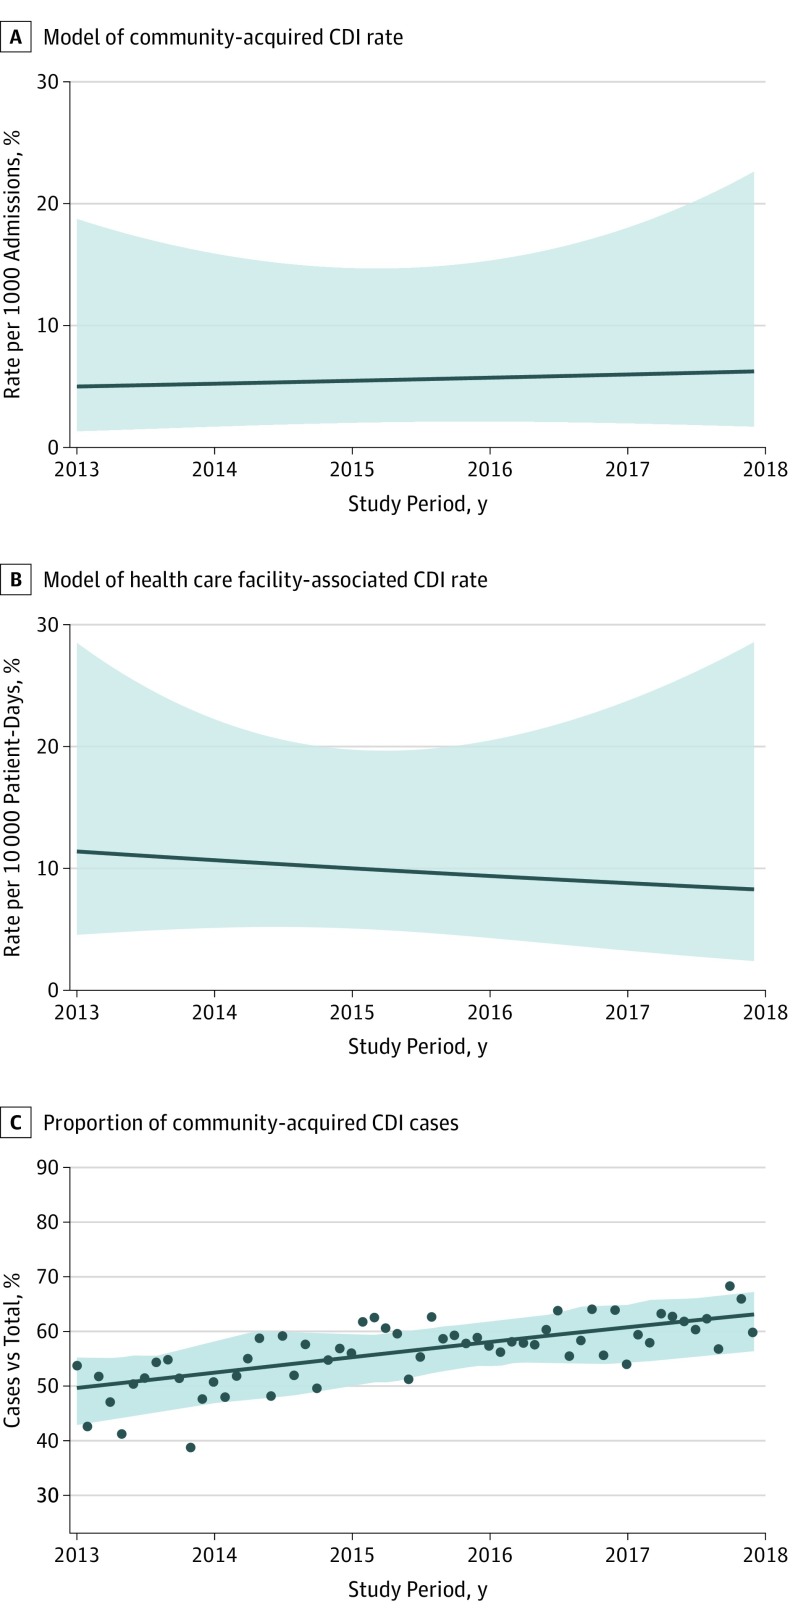
Figure 3. Estimated Trends in Clostridioides difficile Infection (CDI) Incidence Rates Over Time for a Hospital.
A and B, Shaded area represents 95% CI for the model, reflecting the degree of variation between health care facilities. Estimated community-acquired CDI incidence is reported for an urban community hospital with a mean of 941 admissions per month using nucleic acid amplification testing (NAAT) CDI testing. Estimated health care facility–associated CDI incidence is reported for an urban community hospital with a mean of 4078 patient-days per month using NAAT CDI testing. C, Scatterplot points represent mean proportion of community-acquired CDI cases compared with total CDI cases across all facilities for each month in the study period. The line indicates modeled proportion of community-acquired CDI cases using mixed-effects logistic regression; shaded area, 95% CI for the model.

