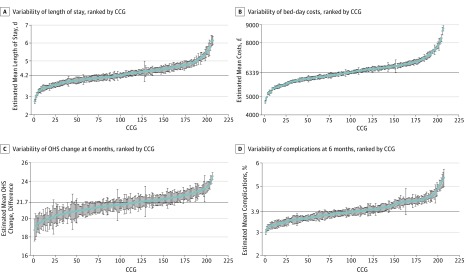
Figure 2. Caterpillar Plots of Patient Outcomes for Primary Hip Replacement by Health Area in England, 2014-2016.
A-D, Horizontal line indicates the estimated mean value for the sample. A, Error bars indicate Poisson SEs of the mean. B-C, Error bars indicate SE of the mean. D, Error bars indicate Poisson SEs of the mean. To convert pounds sterling to US dollars, multiply by 1.23. CCG indicates clinical commissioning group; OHS, Oxford hip score.

