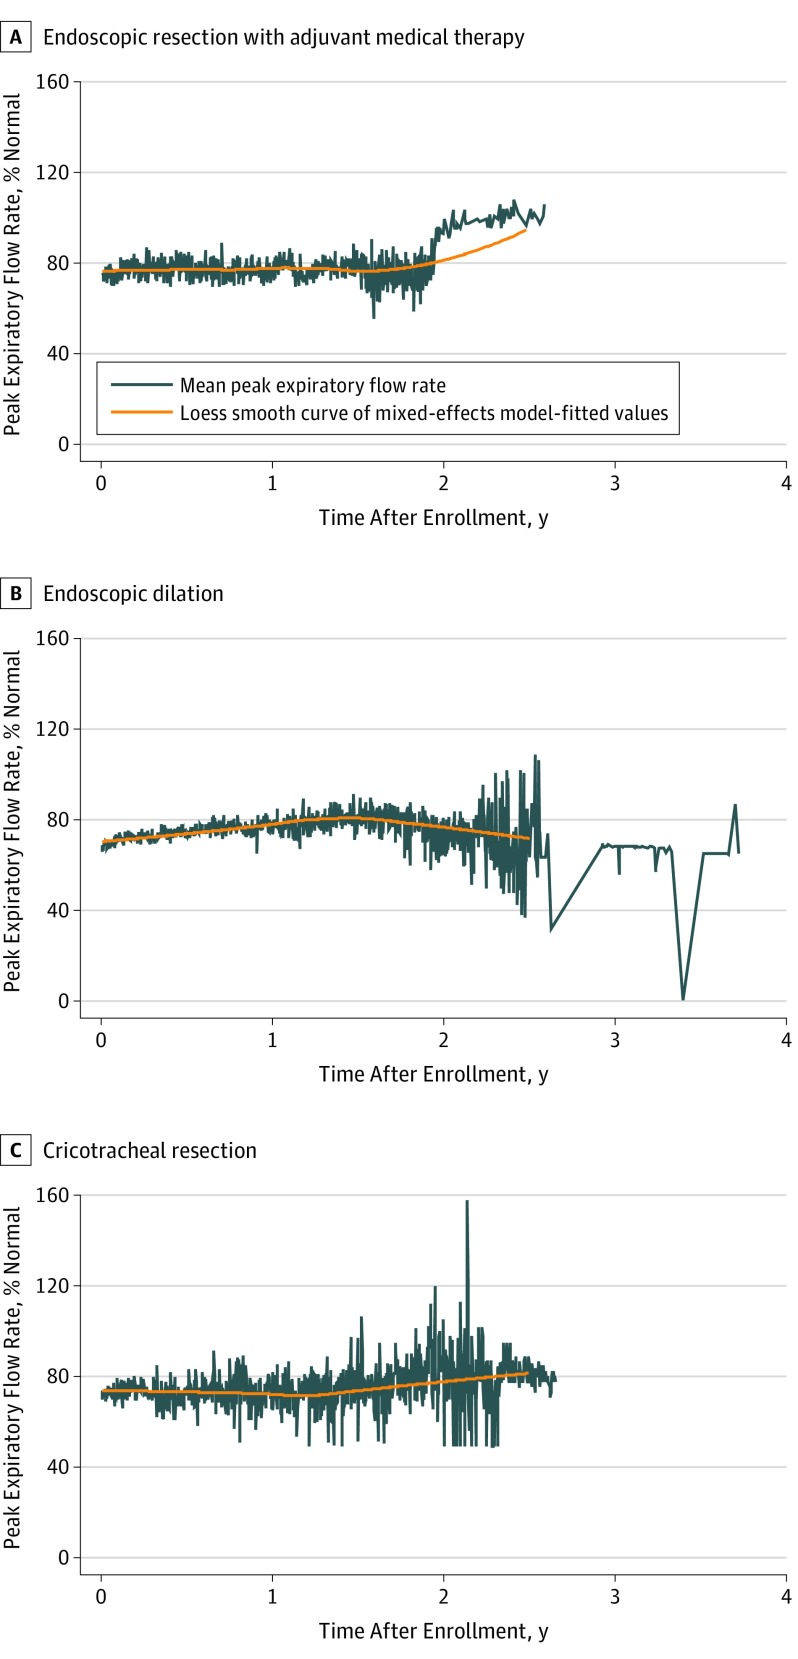
Figure 3. Longitudinal Mean Peak Expiratory Flow Rate Among Patients Without Recurrence in the 3 Treatment Arms.
Loess smooth curve of mixed-effects model shows sustained peak expiratory flow rate (measured in liters per second during a single expiratory cycle and reported as percentage of matched normative data) among patients after successful treatment. Self-reported patient longitudinal peak expiratory flow rate was captured using an inexpensive portable handheld device and a free smartphone app created specifically for this study.

