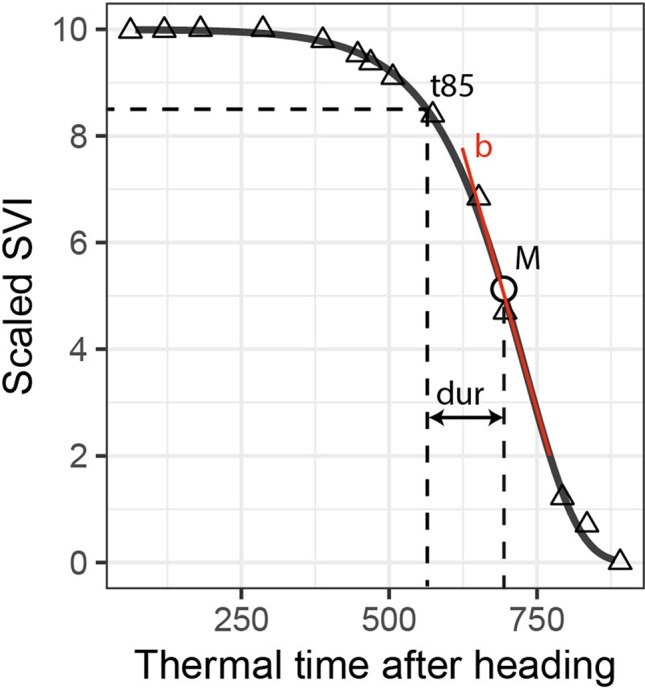
Figure 1.

Extraction of dynamics parameters for one spectral vegetation index (SVI; here scaled values of the plant senescence reflectance index) and one experimental plot (here a non-inoculated control plot). The t85 parameter is the time point when fitted scaled SVI values decrease to 8.5; M is a parameter of the Gompertz model, representing the time point when the rate of decrease is at its maximum; the dur parameter represents the duration in thermal time between t85 and M; and b is a parameter of the Gompertz model, representing the maximum rate of decrease. M and t85 are labeled “key points”; dur and b are labeled “change parameters.”
