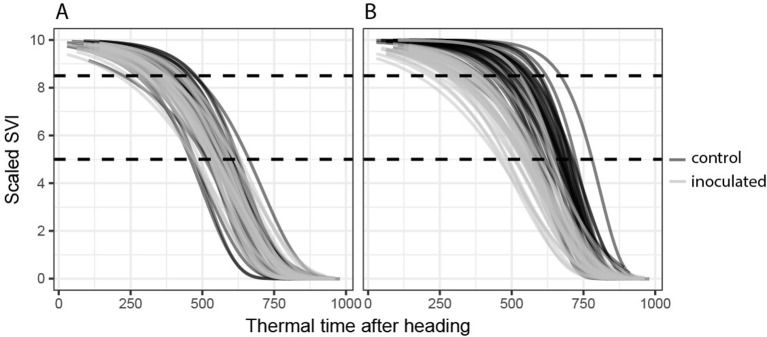
Figure 2.
Temporal dynamics of spectral vegetation indices (SVIs). Gompertz model fits for all 72 experimental plots are shown. (A) A disease-insensitive SVI (here the flowering intensity index, FII) displays the same temporal patterns for both treatments (inoculated and control). (B) A disease-sensitive SVI (here the modified chlorophyll absorption ratio index, MCARI2) displays contrasting temporal patterns for control and inoculated plots.

