Figure 4.
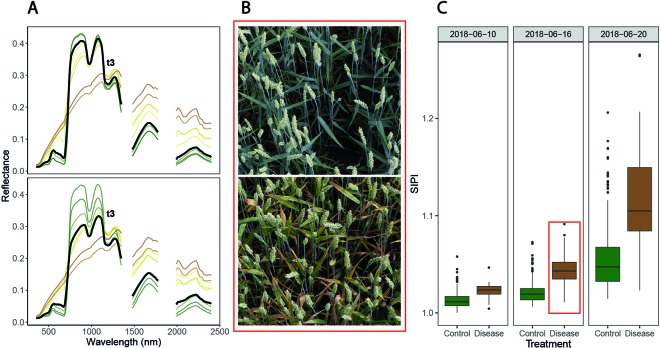
Symptoms of Septoria tritici blotch (STB) and associated spectral reflectance characteristics over time. (A) Date-wise averaged reflectance spectra of healthy canopies (upper panel) and of inoculated, diseased canopies (lower panel). Colors approximate the average color of the vegetation on the corresponding measurement date (estimated based on average visual canopy senescence scorings). The thick black spectra mark the average reflectance spectra measured at t3 (i.e., June 19, 2018). (B) Images of two inoculated plots, taken on June 16, 2018. The genotype in the upper panel was highly resistant to STB, developing visible symptoms only later, whereas the genotype in the lower panel was highly susceptible and displays severe symptoms of STB. Images were captured using the field phenotyping platform (FIP, Kirchgessner et al., 2017). (C) Values of the structure insensitive pigment index (SIPI) for both treatments on three measurement dates. The plots shown in panel B are contained in this boxplot (indicated by the red box). No obvious signs of apical senescence were visible by June 20, 2018, in any of the healthy control plots, but senescence started shortly after.

