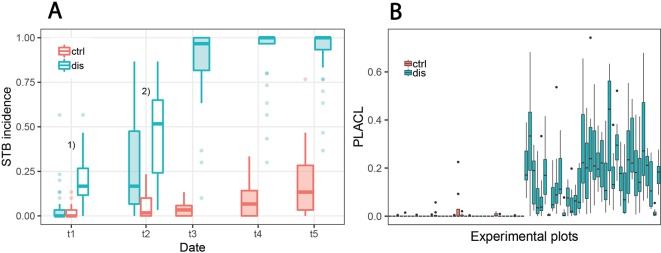
Figure 5.
Development of Septoria tritici blotch (STB) disease. (A) STB incidence at five different assessment dates for non-inoculated “healthy” control plots (ctrl) and for artificially inoculated “diseased” plots (dis). In diseased plots, STB incidence on flag leaves was assessed at all time points, whereas for the control plots, it was assessed only from t3 onward. Filled boxes represent STB incidence on flag leaves; open boxes represent STB incidence on lower leaf layers. 1)Open boxes represent STB incidence on third leaves from the top; 2)open boxes represent STB incidence on second leaves from the top. (B) Conditional disease severity measured as percent leaf area covered by lesions (PLACL) at t3 (June 19, 2018) for eight flag leaves per plot for all 72 experimental plots.

