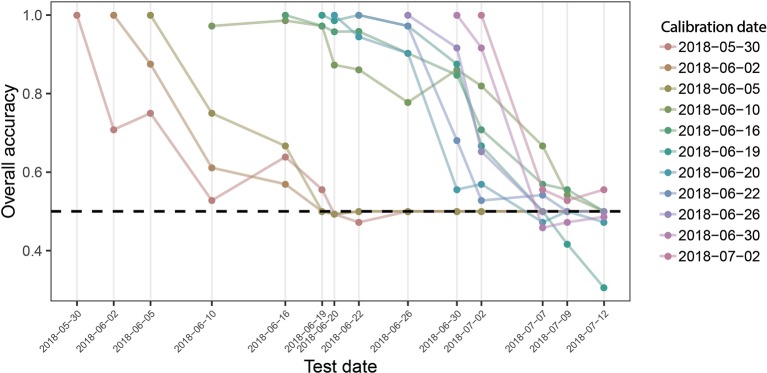
Figure 7.
Overall prediction accuracy of PLSDA models across time. Binary classification models were calibrated for each measurement time point, using reflectance spectra collected on this date as predictors and the known class label (i.e., “diseased” or “healthy”) as response. The performance of these models was evaluated on held out samples of the same date as well as on all plots of the subsequent measurement time points as the overall accuracy of classification. Colored lines track the performance of each date-specific model across time (e.g., the left-most red line represents the performance of the model calibrated with spectra obtained on May 30, 2018, when tested on the same date, and for all subsequent measurement dates). The broken black line indicates a performance of 0.5, i.e., the performance of a random guess of the class label.

