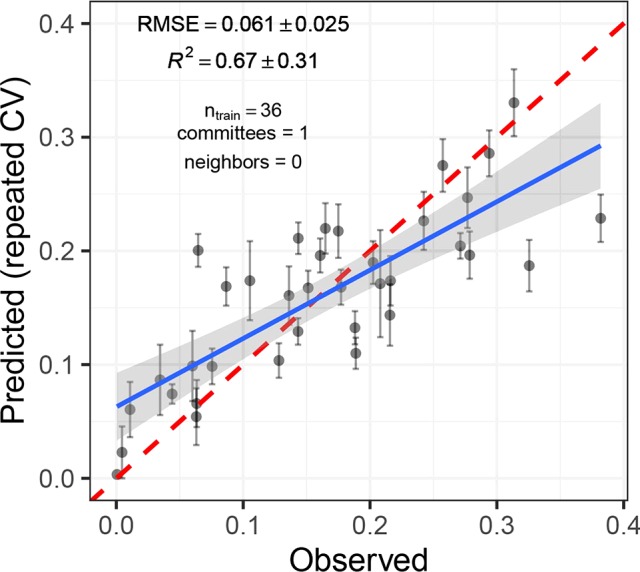
Figure 8.

Predicted vs. observed Septoria tritici blotch (STB) severity levels of 36 artificially inoculated wheat plots. Mean and standard error of predictions are shown. STB severity was measured on flag leaves using a combination of visual incidence scorings and scans of flag leaves exhibiting disease symptoms. Predictions were obtained from a cubist regression model based on the reflectance spectrum of the canopies measured on June 19, 2018. The broken red line represents the 1:1 line, the blue line represents the least squares line of the linear regression of predicted vs. observed values, and the gray area represents the 95% confidence interval of the least squares line.
