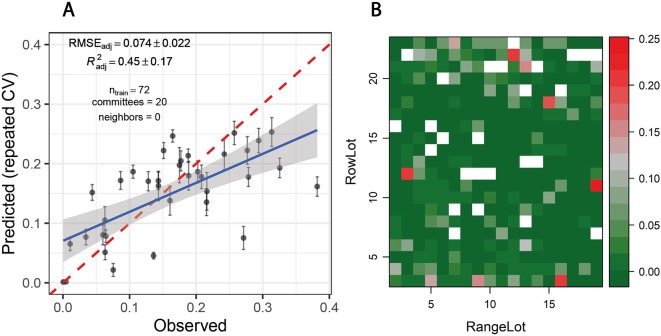
Figure 9.
(A) Predicted vs. observed Septoria tritici blotch (STB) severity levels of 36 artificially inoculated wheat plots. Mean and standard error of predictions are shown. Data from all experimental plots (n = 72) was used to tune/train the model, but reported performance estimates are based only on artificially inoculated plots (n = 36) in order to avoid overly optimistic performance estimates resulting from a good prediction of disease severity in control plots. STB severity was measured on flag leaves using a combination of visual incidence scorings and scans of flag leaves exhibiting disease symptoms. Predictions were obtained from a cubist regression model based on spectral–temporal features for the same 36 plots and 36 non-inoculated control plots sown with the same genotypes. The broken red line represents the 1:1 line, the blue line represents the least squares line of the linear regression of predicted vs. observed values, and the gray area represents the 95% confidence interval of the least squares line. (B) Spatial distribution of predicted STB severity levels of ∼360 largely disease-free plots of the GABI wheat panel, grown next to the plots used as training dataset. White fields correspond to the plots contained in the training dataset.

