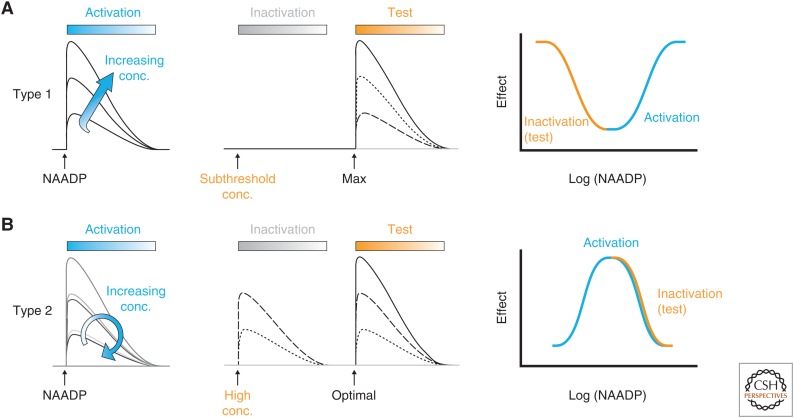
Figure 3.
Differences between desensitization of mammalian and sea urchin nicotinic acid adenine nucleotide diphosphate (NAADP) receptors. (A) Desensitization of sea urchin NAADP receptors (type 1 desensitization). The blue left panel traces show stylized Ca2+ dye fluorescence traces in response to increasing concentrations (conc.) of NAADP, which increases Ca2+ release represented by a classical sigmoid log concentration–response curve (blue line, right panel). However, preincubation with subthreshold concentrations of NAADP, that do not evoke Ca2+ release, desensitize Ca2+ release in a time and concentration manner, by subsequent challenge by a normally maximal NAADP (test) concentration (middle panel, and orange curve, right panel). (B) Desensitization of mammalian NAADP receptors (type 2 desensitization). Increasing concentrations of NAADP enhances Ca2+ release to a maximum (left and middle panels). Thereafter, increasing concentrations of NAADP evoke progressively smaller Ca2+ release to a point when no Ca2+ release is evoked at high NAADP concentrations. This “bell-shaped” or hormetic log concentration–response curve is shown in the right panel (blue curve).

