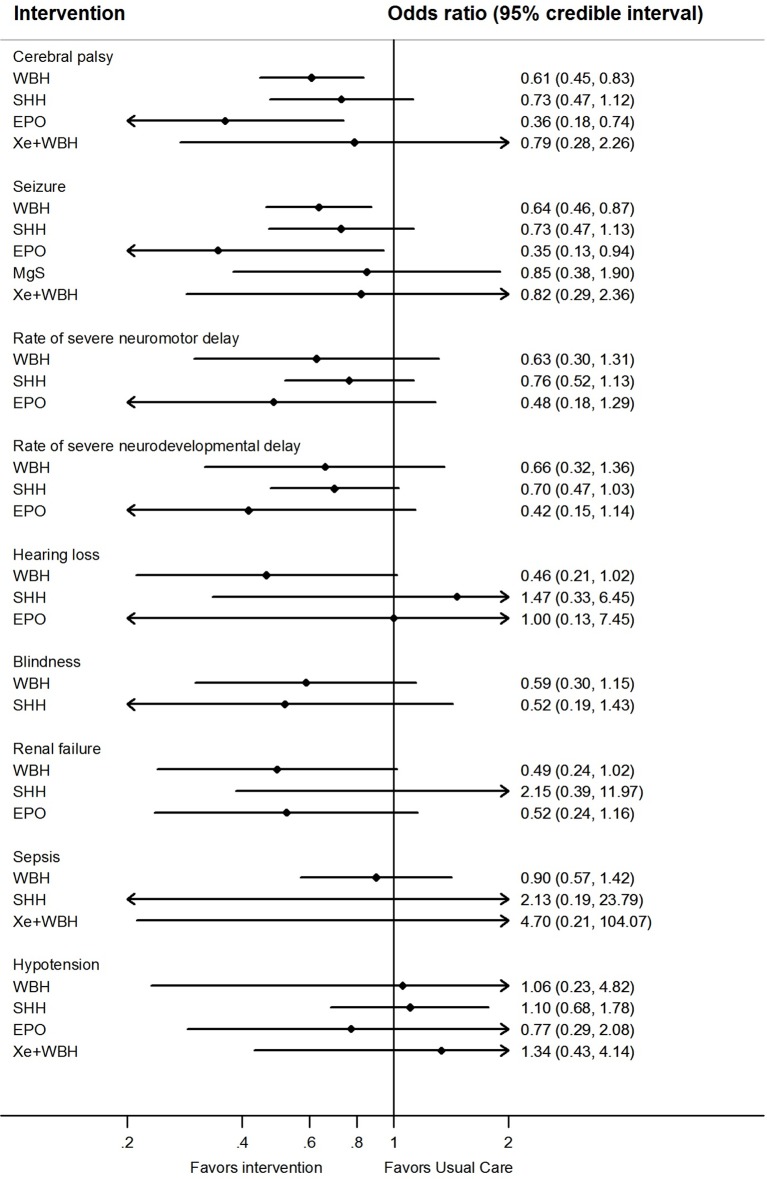
Figure 3.
Network meta-analysis forest plots for each treatment versus usual care on secondary outcomes. Each rhombus represents the summary treatment effect estimated in the network meta-analysis on the odds ratio (OR) scale. The black horizontal lines represent the credible intervals (CrI) for the summary treatment effects; an odds ratio > 1 suggests that usual care is more effective to reduce the risk of mortality, whereas an OR < 1 suggests that the comparable treatment is better. The vertical blue line corresponds to an OR = 1.

