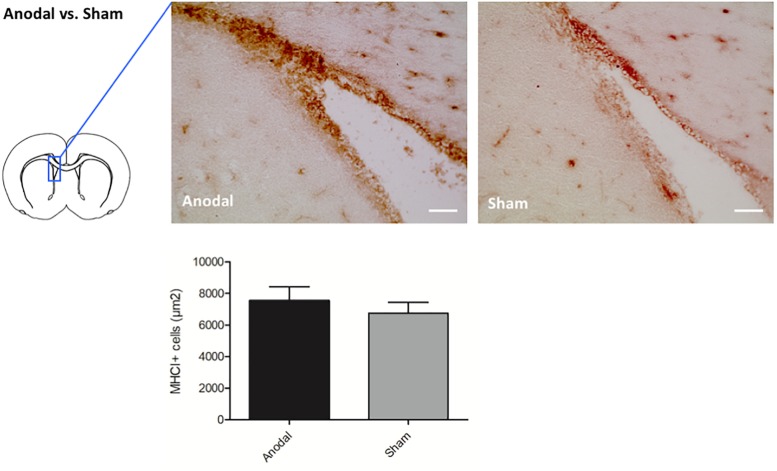
FIGURE 1.
Effects of anodal tDCS on protein expression. Representative immunohistochemical images of Ox18 + cells in the SVZ ipsilateral to anodal tDCS or sham stimulation. Staining for Ox18 (MHC I) in the ipsilateral SVZ revealed more Ox18 + cells in animals treated by anodal tDCS (left panel) compared to sham stimulation (right panel) by trend (scale bars = 100 μm). Results are displayed as mean ± SEM.

