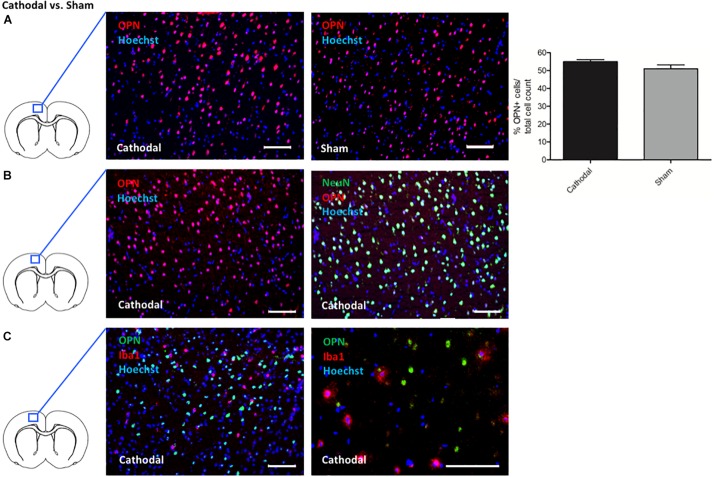
FIGURE 2.
Effects of cathodal tDCS on protein expression. (A) Representative immunohistochemical images of OPN + cells (red) in the cortex ipsilateral to cathodal tDCS or sham stimulation, co-stained with a nuclear marker (Hoechst; blue). Staining for OPN revealed more OPN + cells in the cortex of animals treated by cathodal tDCS (left panel) compared to sham stimulation (right panel) by trend (right panel; scale bars = 100 μm). Results are displayed as mean ± SEM. (B) Representative immunohistochemical images of OPN + cells co-stained with NeuN (green) in the cortex ipsilateral to cathodal tDCS. All images were co-stained with a cell nucleus marker/DNA dye (Hoechst; blue). OPN + cells almost exclusively co-expressed NeuN (left panel and right panel represent the same picture with and without NeuN fluorescence signal, scale bars = 100 μm). (C) Representative immunohistochemical images of OPN + cells (green) co-stained with Iba1 (red) in the cortex ipsilateral to cathodal tDCS. All images were co-stained with a cell nucleus marker/DNA dye (Hoechst; blue). OPN + cells did not express Iba1 (left panel and right panel represent different magnifications, scale bars = 100 μm).

