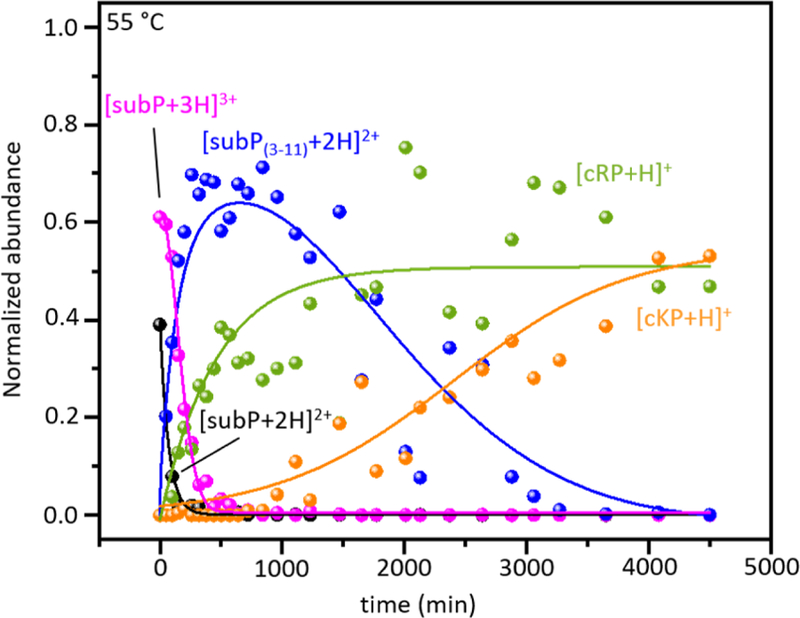
Figure 2.

Normalized solution abundance profiles (obtained from measured ion intensities as discussed in the text) of reactants, intermediates and products that appear throughout incubation of subP in ethanol at 55 °C. The lines are shown only as visual aids.
