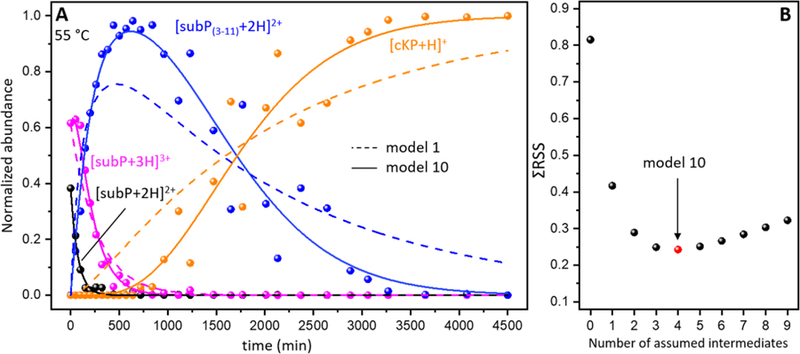
Figure 4.

The left panel (A) depicts normalized abundances of subP charge states, subP(3–11), and cKP as the incubation progresses at 55 °C. cRP was not incorporated in the normalization and fitting of the kinetic data as it shares the same channel as subP(3–11). Kinetic fits from two model pathways are shown, including model 1 shown as dashed lines, and model 10 as solid lines (see Table 1 for details). The right panel (B) shows a list of summed residuals (ΣRSS) from models involving a number of subP(3–11) intermediates prior to dissociation. Model 10, possessing the lowest calculated ΣRSS, is indicated in (B).
