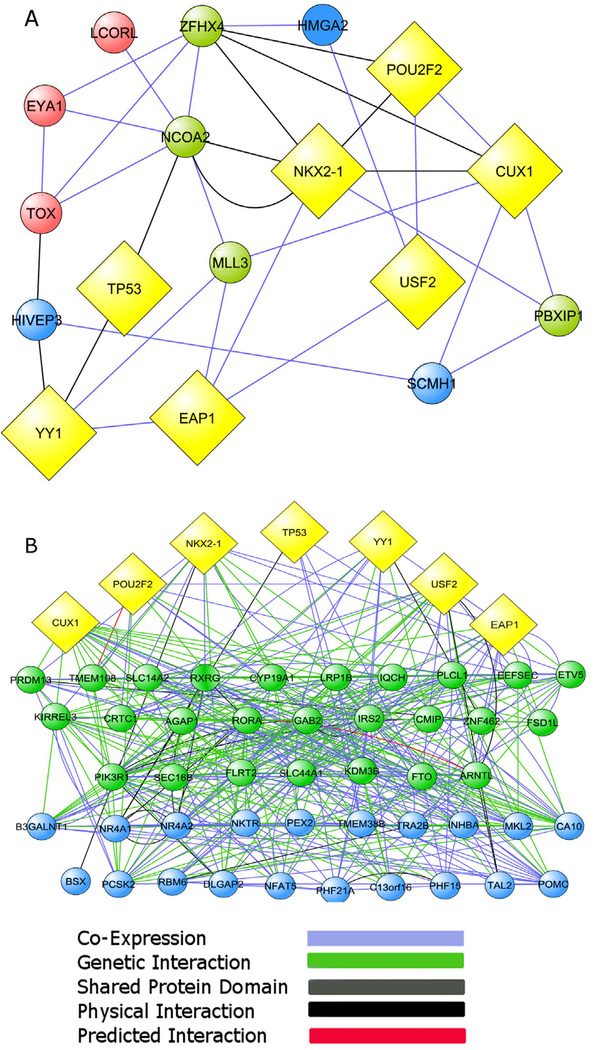
Fig. 2. Network connectivity of the most interconnected bovine puberty genes and human menarche-related genes to the central nodes of a TRG network derived from rats and nonhuman primates.
(A) The ten most connected genes of a bovine puberty gene network (Fortes et al., 2011) are first neighbors of the TRG central nodes (depicted as yellow diamonds). (B) Genes identified by GWAS as associated to the age of human menarche (Ong et al., 2009; Perry et al., 2009; Sulem et al., 2009; He et al., 2009; Elks et al., 2010; Cousminer et al., 2013; Tanikawa et al., 2013) are also highly connected to both the five original TRG central nodes (Roth et al., 2007 and to the upper-echelon transcriptional regulators TTF1/NKX2.1 and EAP1/IRF2BPL (yellow diamonds). Bovine puberty genes and menarche-related genes connected to multiple TRGs are depicted as green circles. Genes connected to at least one TRGs are shown as blue circles. Genes not connected to any TRG are represented as red circles. In both cases the connectivity is via co-expression (blue), predicted interaction (red), shared protein domain (gray), physical interactions (black), and genetic interaction (green) indicated by the GeneMANIA network construction algorithm. The thickness of each line indicates the strength of the evidence supporting that type of interaction in the Gene MANIA database. The distribution of nodes in B does not reflect a hierarchical distribution; instead it intends to emphasize the different degrees of connectivity that exists between central TRGs and menarche-related genes.

