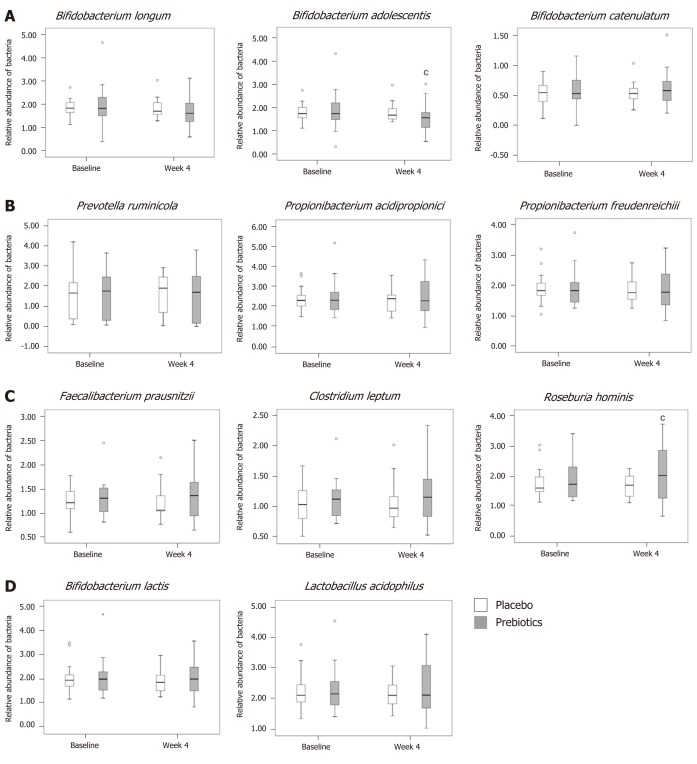
Figure 3.
Analysis of Relative abundance. A: Relative abundance of acetate-producing bacteria; B: Propionate-producing bacteria; C: Butyrate-producing bacteria; D: Prebiotic-sensitive bacteria. In the prebiotics group, the relative abundance of Bifidobacterium adolescentis was decreased and that of Roseburia hominis was increased after 4 wk of intervention. Box plots show the 25th and 75th percentiles, median, and range. Outliers are expressed as a small circle. cP < 0.05. Significantly different from the values at baseline, using the Student’s t-test.

