Figure 3.
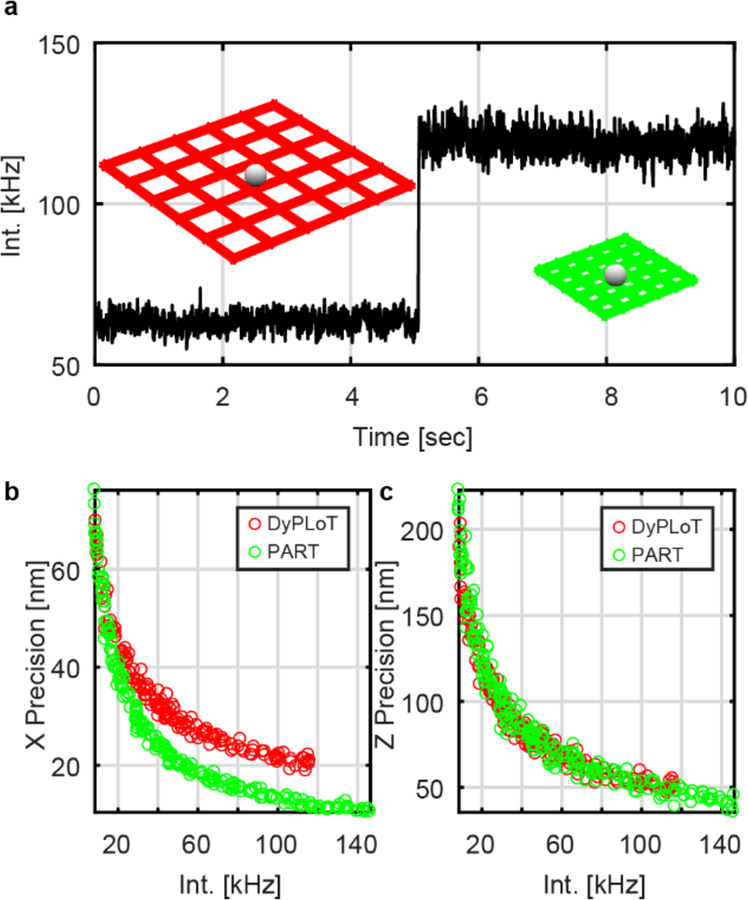
(a) Collected emission intensity from a fixed fluorescent nanoparticle using 3D-DyPLoT (t < 5 sec) and 3D-PART (t > 5 sec). (b) Lateral (XY) tracking precision comparison between 3D-DyPLoT (red circles) and 3D-PART (green circles) at varying count rates. (c) Axial (Z) tracking precision comparison between 3D-DyPLoT (red circles) and 3D-PART (green circles) at varying count rates. In both cases, the axial scan range (~ 2 μm) is the same. The improvement in the lateral precision increases due to the (1) the finer sampling in the XY plane and (2) the increased photon count rate. Since the axial sampling is not changed, the axial precision is only increased indirectly by the increase in photon count rates. Bin size: (a) 1 ms; (b, c) 100 ms. Background level for all experiments: ~ 200 Hz.

