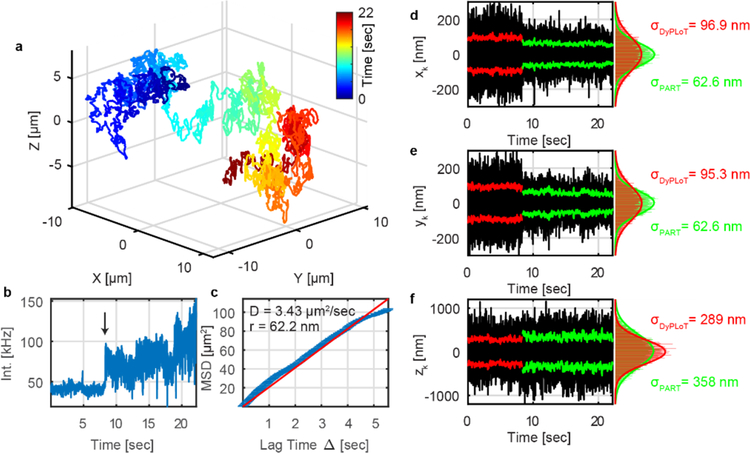
Figure 4.
Tracking Brownian motion of 110 nm beads in water with precision modulation switching on at time=7.4 s. (a) 3D moving trajectory of beads. (b) Fluorescence intensity as a function of time. At the time indicated by the arrow the tracking was switched from 3D-DyPLoT to 3D-PART. (c) MSD of the trajectory in (a). The blue line is the measured MSD while the dotted red line is best fit line from linear regression. (d-f) x, y and z real-time tracking precision as a function of time. Bin size: 1 ms.

