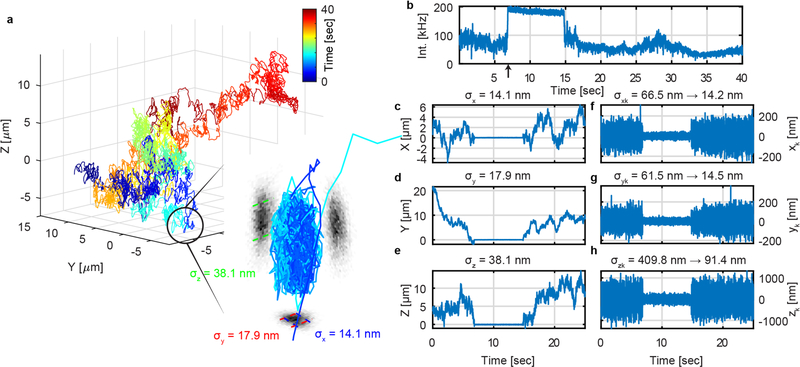
Figure 5.
3D-PART enables tracking of heterogeneous dynamics. (a) 3D trajectory of 110 nm green fluorescent bead freely diffusing and intermittently binding to the coverslip. The inset is a zoom in on the part of the trajectory where the particle is bound to the coverslip. The precision of the XYZ stage readouts are labeled as σx,σy, σz, respectively, showing good agreement with the fixed particle data shown in Figure 2. (b) Intensity trace of the particle shown in (a). The spike in intensity (from ~100 kHz to ~200 kHz, indicated by arrow) results from the shrunken scan area dictated by 3D-PART. (c-e) The X, Y, and Z position of particle as a function of time as measured by the piezoelectric stage position. The σx,σy, σz on top of the plots are the standard deviations for the X, Y, and Z stage readout while the particle is bound. (f-h) Deviation of particle from center of tracking volume during diffusion and landing events as measured by the real-time position estimation algorithm. A drastic reduction in the variance of the position estimates can be seen coinciding with the binding of the particle to the coverslip and the spike in intensity (indicated by arrow).” The values σxk,σyk, and σzk demonstrate the change in the particle position uncertainty as the particle transitions from free diffusion to bound on the coverslip. Bin size: (b-h) 1 ms.

