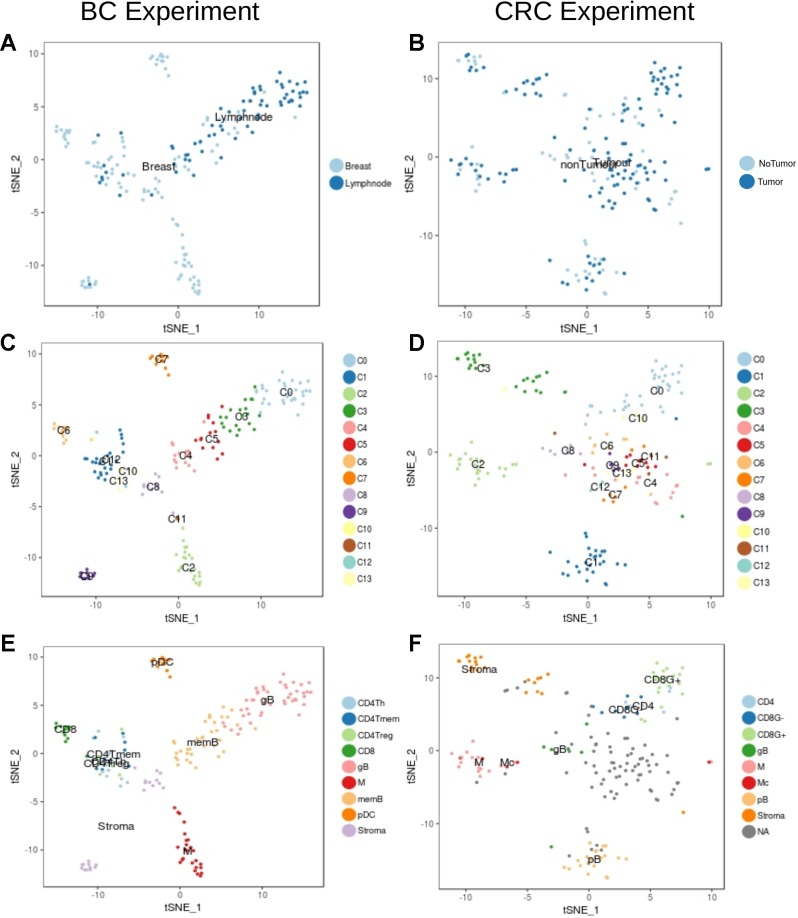
Figure 3.
Unbiased t-SNE representation of non-tumor single-cells from Breast and Colorectal samples. Each dot represents a single-cell colored by: (A) Non-tumor cells extracted from the BC tumor sample or from matched lymph nodes (B) Non-tumor cells from the CRC tumor sample or from matched healthy tissue (C) Graph-based clusters identified by Seurat in the BC experiment and in the (D) CRC. (E) and (F) colored by the cell type classification.

