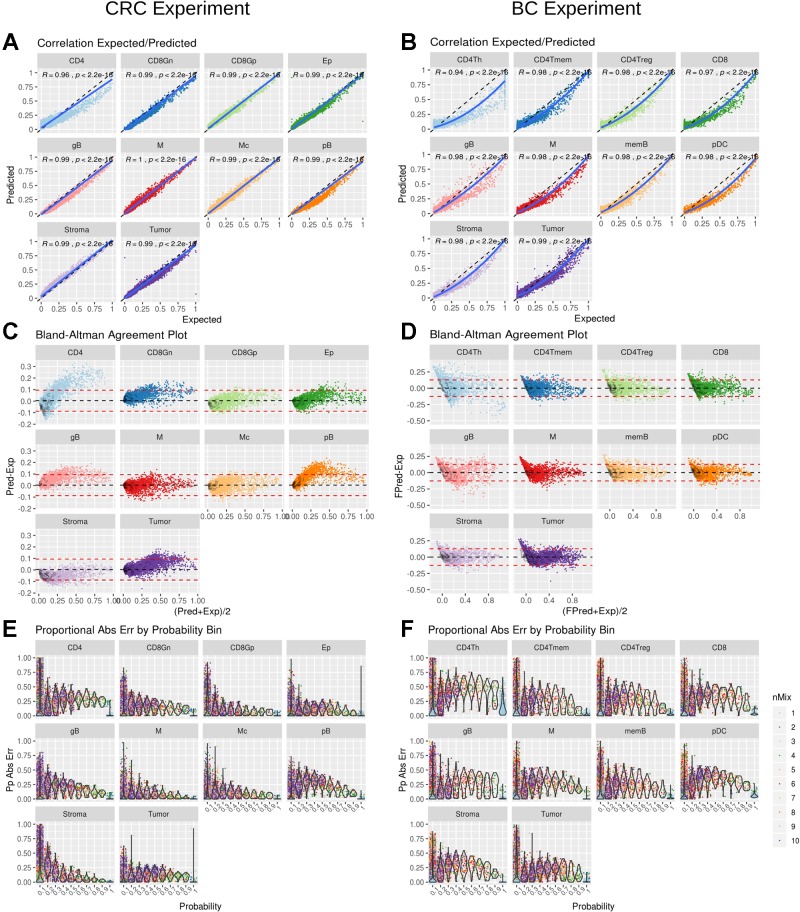
Figure 4.
DigitalDLSorter performance in the test set. Correlation between real (Expected) and Predicted proportions for each cell type from the CRC model (A) and BC model (B). Correlation coefficient and p-value of a linear (CRC) and quadratic fit (BC) are shown. The solid line represent the fit of the corresponding model. The dashed line represents the identity. Bland-Altman agreement plot for the CRC (C) and the BC (D) models. The red dashed lines represent +/- 1.96 x std deviance from the mean (dashed black line) (E) and (F) Absolute Proportional Error binned by frequency and arranged by cell type for CRC (E) and BC (F) models.

