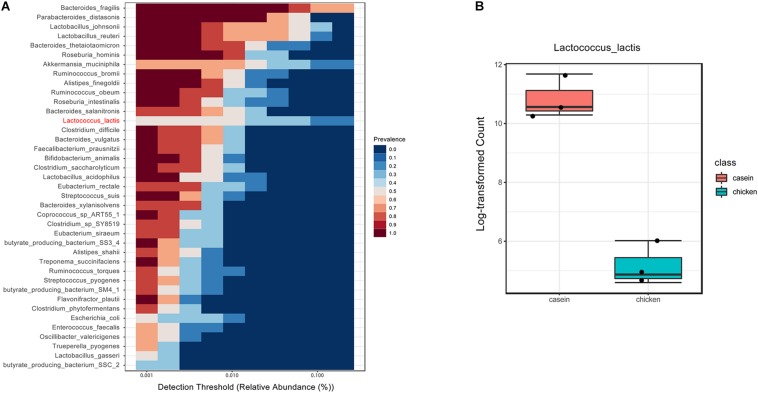
FIGURE 2.
Core microbiota in cecum of rats fed with CAD and CHPD. (A) The bacteria prevalence at different detection thresholds by MicrobiomeAnalyst in which sample prevalence was set to 20% and relative abundance was set to 0.2%. The species marked in red was significantly different between the two diet groups. (B) The abundance of Lactococcus lactis in cecum of rats fed with CAD and CHPD.

