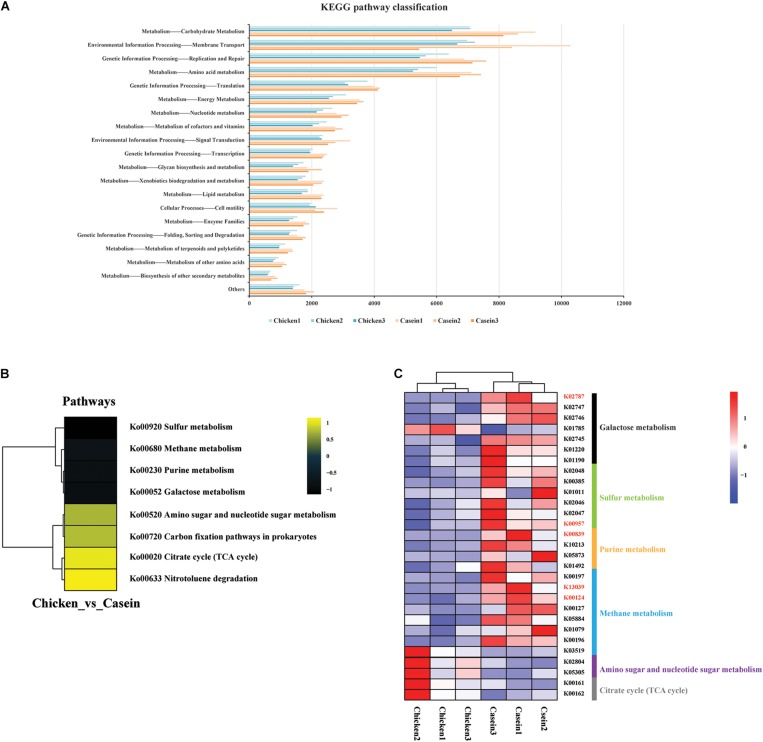
FIGURE 3.
Functional analysis of the cecal microbiota of the rats fed chicken and casein protein diets. (A) KEGG pathway classification on level two. (B) Differential KEGG pathways analyzed by gage, R package. Only those with P value < 0.05 were shown. (C) KOs involved in the differential pathways between CAD and CHPD. Only the KOs with P value < 0.05 were shown. The KOs in red represent the Padj < 0.05.

