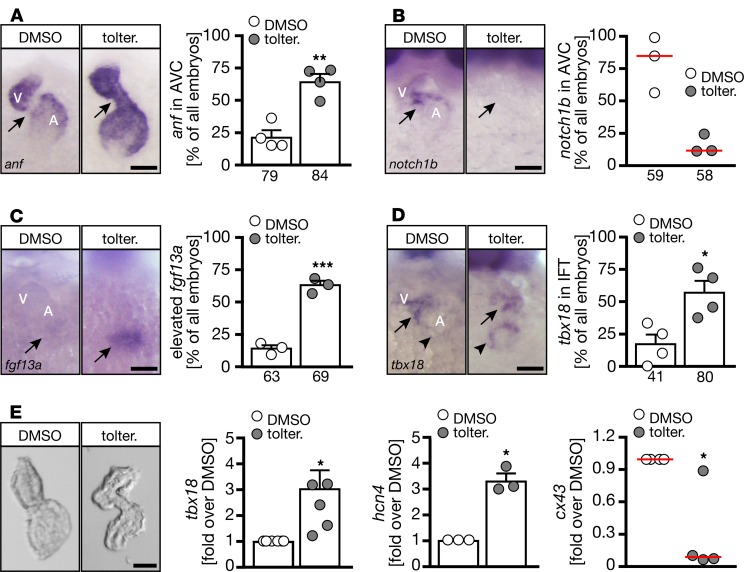
Figure 8. Tolterodine promotes pacemaker cell fate at the expense of AVC cells.
(A–D) Representative images of whole-mount in situ hybridizations at 48 hpf. A, atrium; V, ventricle. Numbers of embryos studied are indicated below the bars. n = 3–4 experiments. (A) AVC cells aberrantly express anf, which is characteristic of working myocardium and normally excluded from the AVC. **P = 0.0013, 2-tailed t test with Welch’s correction. (B) Upon tolterodine treatment, notch1b expression was lost. P = 0.100, 2-tailed Mann-Whitney U test. (C) Tolterodine provoked an increase in the pacemaker marker fgf13a. ***P = 0.0005, 2-tailed t test with Welch’s correction. (D) Tolterodine increased tbx18 expression in the area of the inflow tract. *P = 0.0158, 2-tailed t test with Welch’s correction. (E) Quantitative PCR (qPCR) analysis of isolated hearts (bright-field images) showed the induction of a pacemaker program by tolterodine. n = 3–6 experiments. *P = 0.0142 (hcn4), 0.0193 (cx43), and 0.0213 (tbx18), paired t test. Scale bars: 50 μm. Bar graphs show mean ± SEM (except for B and tbx18 in E: red line is median). Circles show individual experiments. Arrows indicate changes in expression between panels.

