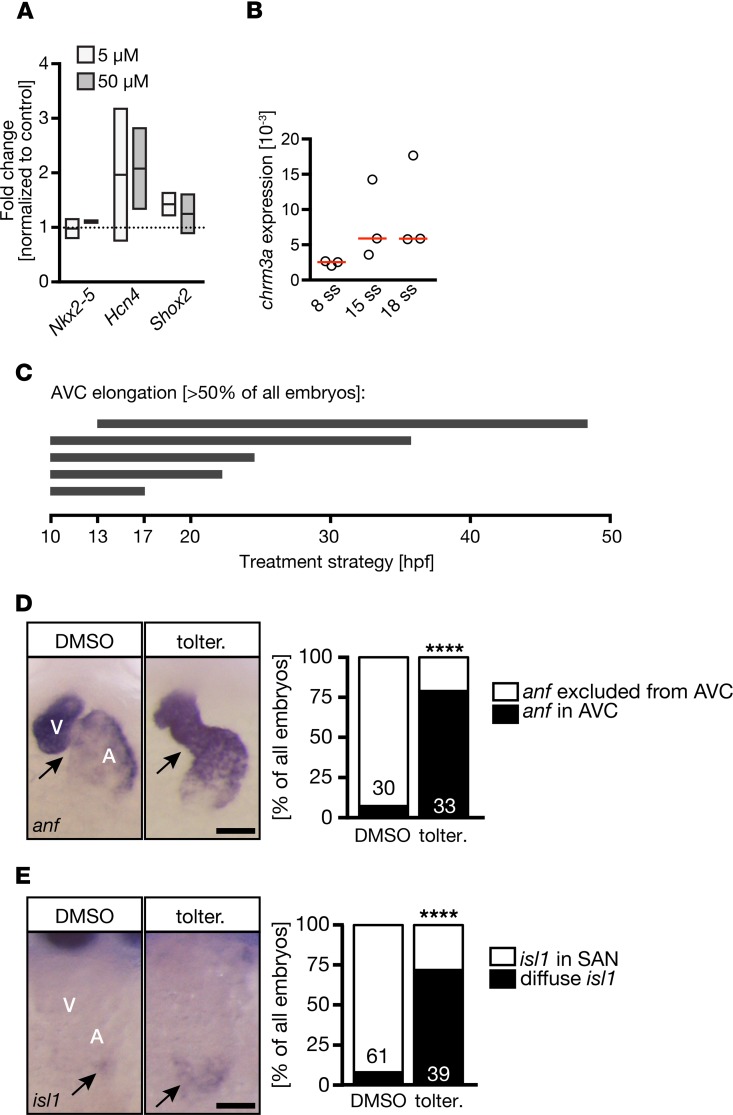
Figure 9. Treatment during CPC stages is sufficient to affect conduction system development.
(A) Tolterodine treatment induced the expression of genes characteristic for pacemaker cells (Hcn4, Shox2) in cardiomyocytes differentiated from human iPSCs. Graph shows qPCR data of treatments. Line indicates mean; box shows minimum and maximum. (B) In zebrafish embryos, the muscarinic receptor M3a was increasingly expressed during CPC differentiation stages. qPCRs of zebrafish at the indicated stages. Chrm3a normalized to gapdh. Red line, median; ss, somite stages. (C) Schematic illustration of different treatment regimens in zebrafish embryos producing AVC elongation in more than 50% of the embryos. (D) Tolterodine treatment between tailbud and 20 ss is sufficient to induce anf expression in the presumptive AVC. Scale bar: 50 μm. Bar graph depicts the number of embryos with or without anf expression in the AVC. n = 2 experiments. The number of individual embryos is given in the graph. ****P < 0.0001, 2-sided Fisher’s exact test. (E) Tolterodine treatment during heart progenitor specification and differentiation stages results in elevated isl1 expression that reaches into the atrium. Scale bar: 50 μm. Bar graph summarizes 2 experiments (embryo number indicated in the graph itself). ****P < 0.0001, 2-sided Fisher’s exact test. SAN, sinoatrial node.

