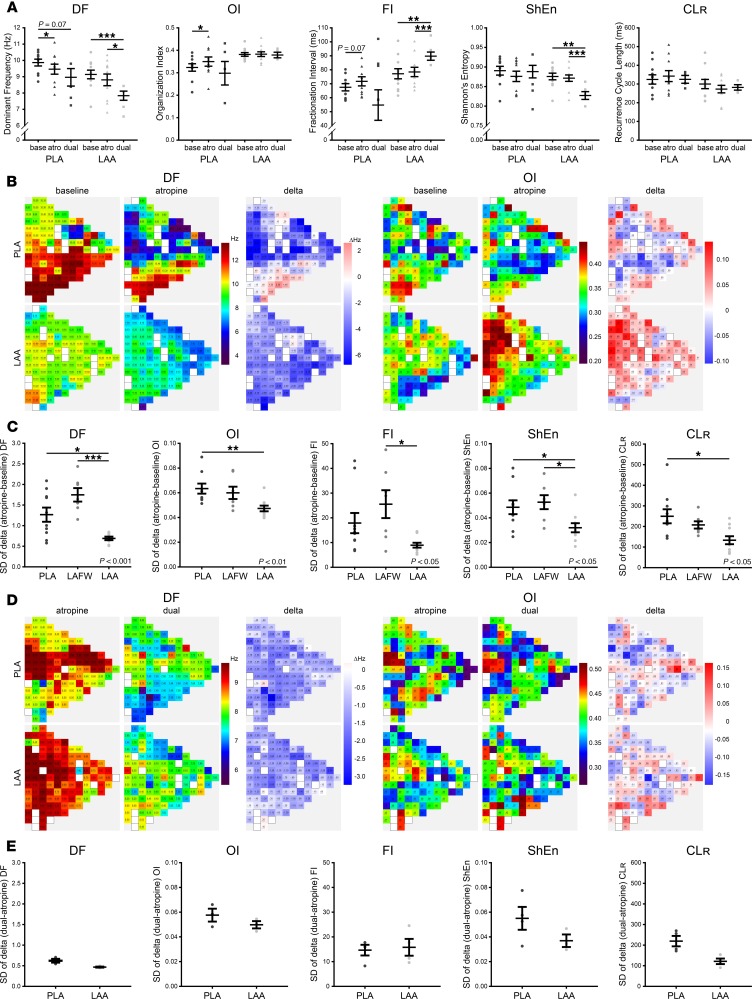
Figure 5. Response to atropine is more homogeneous in the left atrial appendage (LAA), whereas propranolol does not induce a differential response.
(A) Effect of atropine or dual blockade on mean dominant frequency (DF), organization index (OI), fractionation interval (FI), Shannon’s entropy (ShEn), and recurrence cycle length (CLR) in the posterior left atrium (PLA) and left atrial appendage (LAA). n = 10 for baseline and atropine, n = 4 for dual blockade. Data is shown as scatterplot with mean ± SEM from mixed linear model. (B) Representative example of high-density electrode recordings of DF (left panels) and OI (right panels) in the PLA (top) and LAA (bottom) at baseline and after atropine. The change induced by atropine is shown as a Δ map. (C) SD of change induced by atropine in parameters shown in A for the PLA, left atrial free wall (LAFW), and LAA is shown as scatterplot with mean ± SEM. n = 10 in all groups. ANOVA significance indicated in graphs. (D) Representative examples of high-density electrode recordings of DF (right) and OI (left) in the PLA (top) and LAA (bottom) after atropine and dual blockade. The change induced by propranolol is shown as a Δ map. (E) SD of change induced by propranolol in parameters shown in A for the PLA and LAA is shown as scatterplot with mean ± SEM. n = 4 in all groups. ANOVA significance indicated in graphs. *P < 0.05; **P< 0.01; ***P < 0.001 for pairwise comparison with Holm-Sidak method.

