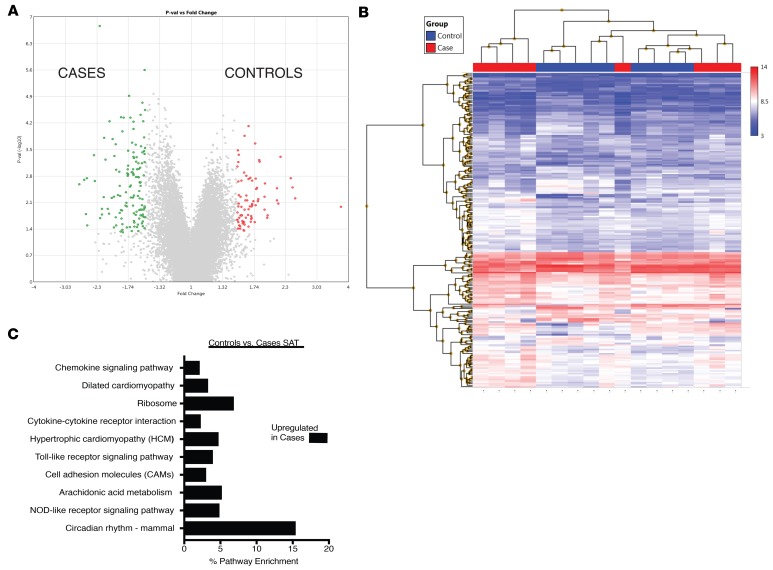
Figure 5. Comparison of gene expression in SAT between cases and controls.
(A) Volcano plot of 218 genes that were differentially expressed at a level of 1.5-fold change (ANOVA P < 0.05). Eighty-two were upregulated in the SAT of control patients (red) and 136 in the SAT of cases (green). (B) Hierarchical clustering of differentially expressed genes in SAT of cases and controls. (C) KEGG pathway analysis of differentially expressed genes in SAT of cases. No pathways were significantly enriched in the SAT of controls.

