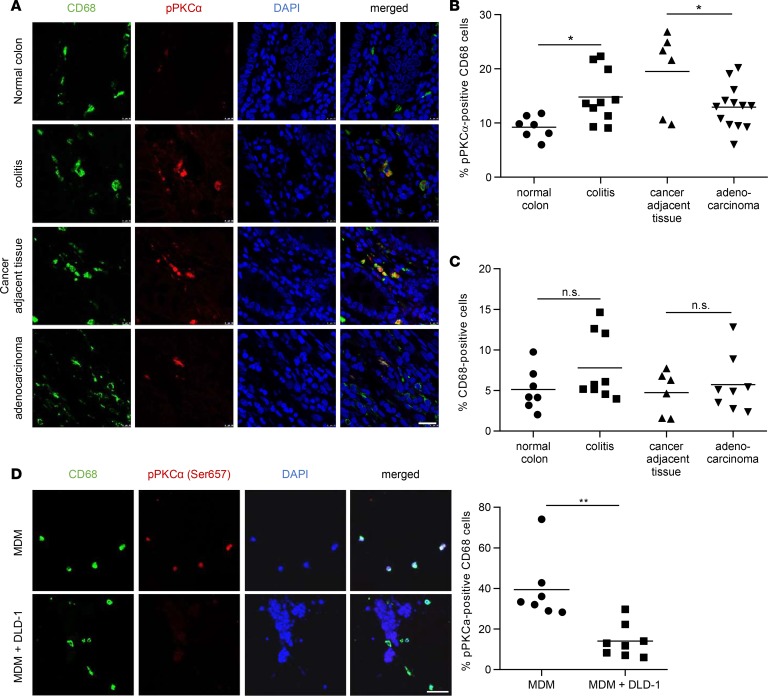
Figure 2. mTORC2 is downregulated in infiltrating macrophages in human CRC.
(A) IF for CD68 (green) and pPKCα (red) in human colorectal tissue sections. Scale bar: 20 μm. (B) Quantitative number and means of pPKCα+CD68+ macrophages. (C) Quantitative number and means of CD68+ macrophages. A–C were evaluated from at least 6 different IF samples. P values were determined by 1-way ANOVA and Bonferroni correction for pairwise comparisons. (D) IF double stain for CD68 (green) and pPKCα Ser657 (red) in collagen gels either with monocyte-derived macrophages (MDM) alone (upper panel) or with MDM cultured with DLD-1 cells (lower panel, nuclear stain only). Quantitative number and means of pPKCα+CD68+ macrophages, evaluated from at least 6 samples. Scale bar: 50 μm. P values were determined by unpaired 2-tailed Student’s t test. *P < 0.05; **P < 0.01.

