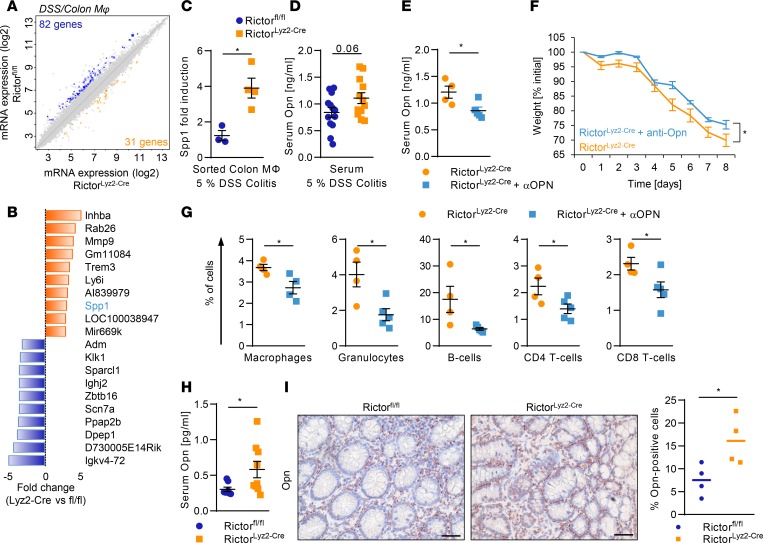
Figure 5. mTORC2 in macrophages suppresses Opn to diminish colitis.
(A) Scatterplot of global gene expression profiles of sorted Rictorfl/fl and RictorLyz2-Cre colonic macrophages on day 8 during DSS-induced colitis is shown. (B) The 10 most highly differentially regulated genes from the microarray analysis in the RictorLyz2-Cre and Rictorfl/fl colonic macrophages are shown. (C) mRNA levels of Spp1 in sorted colonic macrophages on day 8 during 5% DSS-induced colitis. Data represent the mean ± SEM (n = 3–4). (D) Opn levels in serum on day 8 of Rictorfl/fl and RictorLyz2-Cre mice during 5% DSS-induced colitis model are shown. Data represent the mean ± SEM (n = 11). (E–G) RictorLyz2-Cre mice were challenged with 5% DSS in drinking water for 5 days, followed by normal water for 3 days. Mice were i.p. injected with 650 μg/kg Opn-neutralizing antibody or placebo on days 1, 3, and 6. (E) Serum Opn levels in blood on day 8. Data represent the mean ± SEM (n = 5). (F) Weight was monitored daily. Data represent the mean ± SEM (n = 5). (G) Lamina propria cells of the colon were isolated on day 8, and flow cytometric analysis was performed. Data represent the mean ± SEM (n = 4). *P < 0.05. (H) Opn levels in serum of Rictorfl/fl and RictorLyz2-Cre mice after the AOM/DSS model are shown. Data represent the mean ± SEM (n = 12–13). (I) IHC of Opn in colorectal tumor sections of AOM/DSS-treated mice. Scale bars: 40 μm. Right panel, number, and means of Opn+ cells evaluated from 4 IHC samples. P values were determined by unpaired 2-tailed Student’s t test. *P < 0.05.

